")

As we transition into a modern digital landscape, there's an exponential surge in the data streams that applications and infrastructures produce. To decode this enormous amount of data, tools like Grafana and Prometheus have become indispensable. They don't just represent numbers; they provide a narrative about the health, performance, and intricacies of systems.
This blog post dives deep into how these tools work, showcasing some cool features, dashboards, and alerting mechanisms.
Understanding Grafana and Prometheus
Prometheus: An open-source system monitoring and alerting toolkit. Its core functionality is to collect metrics from configured targets at given intervals, evaluate rule expressions within its domain-specific language (PromQL), display results, and trigger alerts if certain conditions are observed.
Grafana: An open-source platform for monitoring and observability. It integrates with Prometheus, allowing users to visualize the collected metrics in comprehensive dashboards. An open-source platform known for its stunning visualizations, it turns the intricate metric data from Prometheus into insightful graphs and alerts, making raw data more digestible and actionable for the human observer.
Interplay Between Grafana and Prometheus
While Prometheus diligently collects and stores metrics, Grafana pulls this data, providing an interface to craft beautiful dashboards. The communication happens over HTTP with Prometheus' API, allowing Grafana to fetch, aggregate, and visualize the data.
Cool Features and Insights
- Ad-Hoc Filters: Grafana allows for on-the-fly querying, letting you extract specific metrics based on current needs without adjusting the original dashboard settings.
- PromQL: Prometheus's native query language, PromQL, allows for intricate querying of data. Whether you're looking to track application performance, resource usage, or system anomalies, PromQL offers robust data manipulation capabilities.
- Dynamic Alerts: Prometheus can be configured to send alerts based on complex conditions. These alerts can be visualized in Grafana, giving a clear indication of system health and potential issues.
- Annotations in Grafana: You can mark your graphs with events like deployments or outages. This helps in correlating metric anomalies with specific events in your infrastructure.
- Templates and Variables: Grafana dashboards are dynamic, meaning you can switch the context (like changing a displayed server or application) without altering the dashboard code. This adaptability is achieved through variables.
Crafting Effective Dashboards
Dashboards should be informative yet not overwhelming. Here's a potential structure to follow:
Overview Dashboard: High-level metrics that give a snapshot of the system's health. Examples: CPU Load, Memory Usage, HTTP Request Rate, and Error Rate.
Node Exporter Dashboard: This provides a comprehensive overview of your system's metrics - CPU usage, memory, network stats, and more. Useful for system administrators to monitor server health.
Kubernetes Cluster Monitoring: If you're using Kubernetes, Grafana has dashboards to monitor cluster health, resource usage (pods, services, nodes), and application metrics.
Detailed Service Dashboards: Focused on specific services. If you had a database, for example, you'd have metrics like Query Rate, Latency, Active Connections, and Cache Hit Rate.
Alert Dashboards: Focused solely on triggered alerts and their details.
Historical Context: Leverage Grafana's time-travel feature. Display historical data alongside real-time metrics to understand trends and anomalies.
Example Dashboards
NGINX Ingress Controller Dashboard
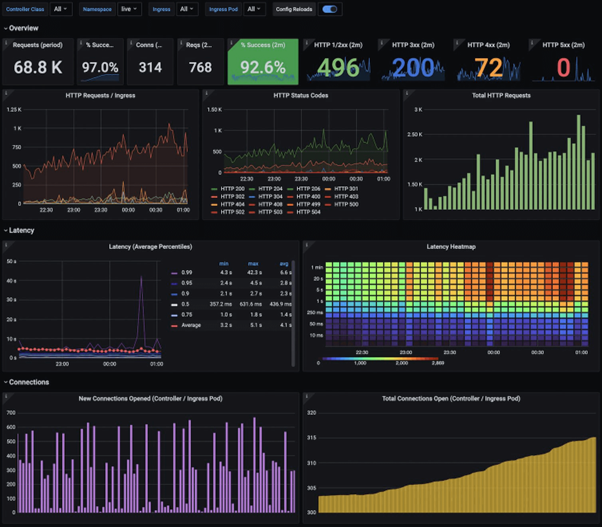
https://grafana.com/static/assets/img/blog/kubernetes_nginx_dash.png
Kubernetes Global Dashboard
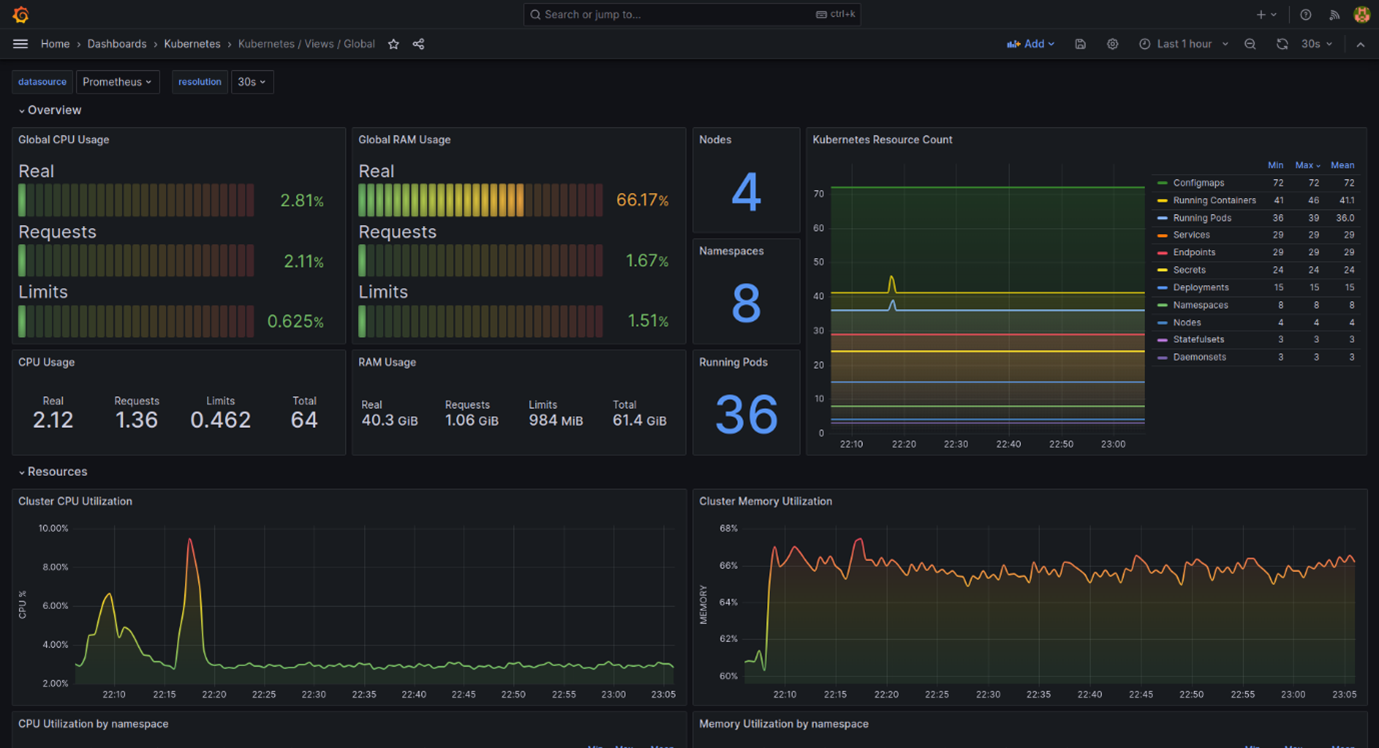
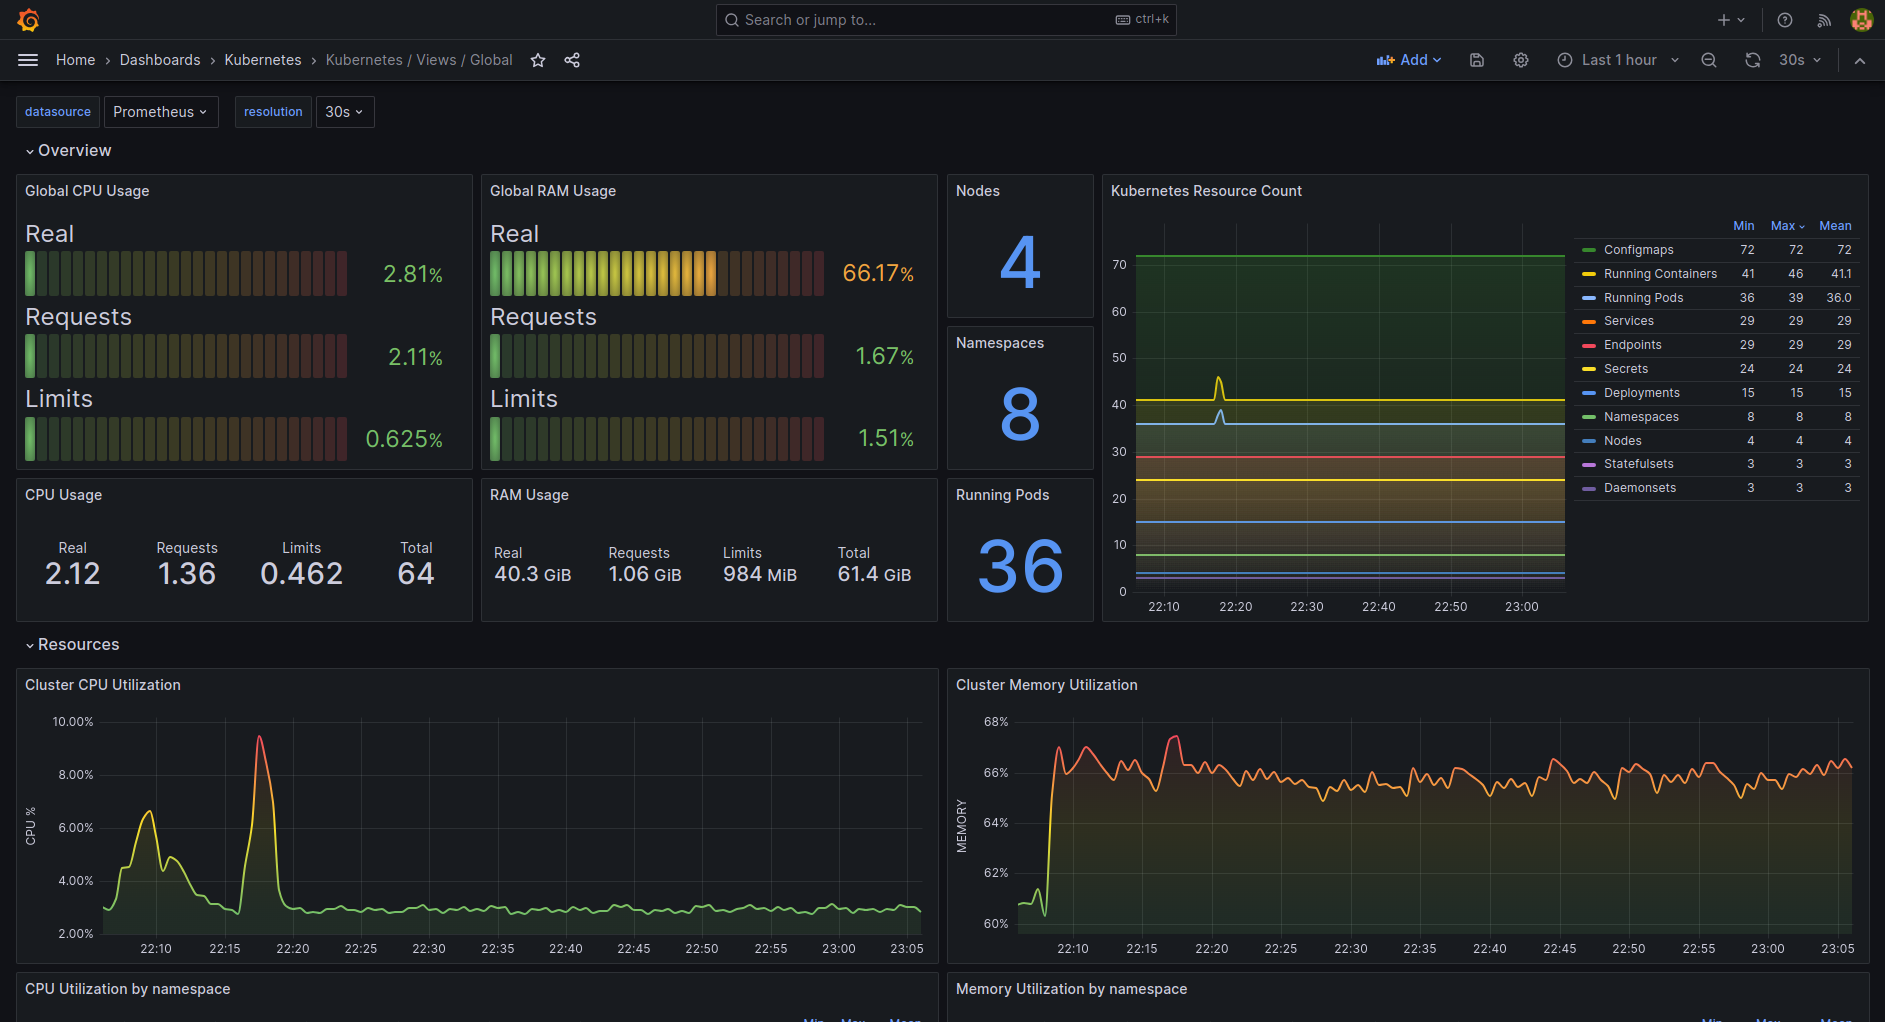
Kubernetes Pods Dashboard
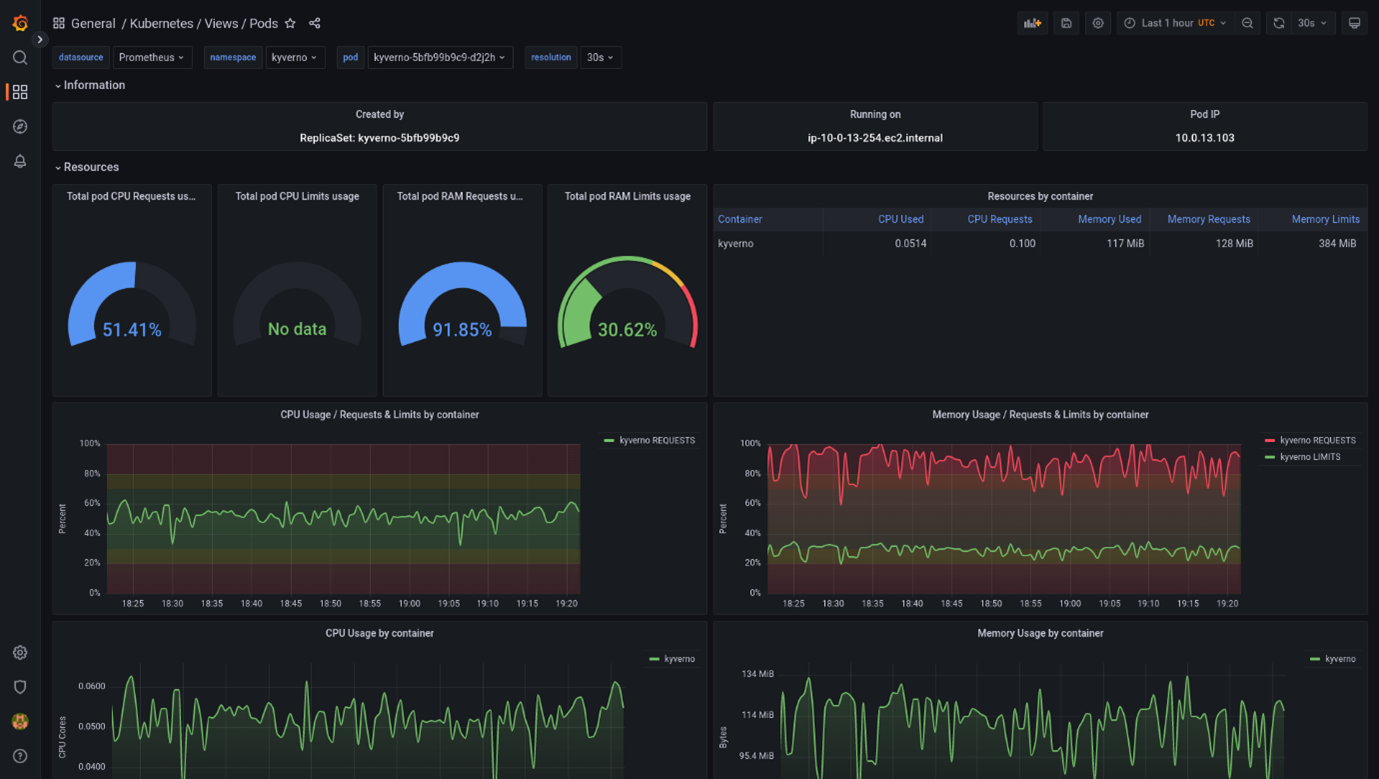
https://grafana.com/api/dashboards/15760/images/12599/image
Alerting Mechanism in Grafana
Grafana allows you to set up alerts to notify you when specific conditions are met. Here's a simple example:
Step 1: Open the dashboard panel where you want to add an alert.
Step 2: Click on the "Alert" tab and then "Create Alert."
Step 3: Define your alert conditions. For instance, you might want an alert when the average CPU usage is above 80% for 5 minutes.
Step 4: Decide how you want to be notified - via email, Slack, webhook, etc.
Step 5: Save the dashboard.
When the conditions specified are met, Grafana will trigger the alert and send a notification via the defined method.
These alerts can be visualized in Grafana, but more importantly, they can be forwarded to various alertmanager setups. An alertmanager can integrate with communication platforms like email,Microsoft Teams, Slack, or PagerDuty, ensuring the right people get informed promptly.
Alerting Mechanism in Prometheus
Prometheus goes beyond just collecting metrics; it offers a robust alerting mechanism. Here's how you can set up an alert:
Define Alert Rules: Create a YAML file with your alert rules. For instance, to alert for high memory usage:
<YAML START>
groups:
- name: example
  rules:
  - alert: HighMemoryUsage
    expr: (node_memory_MemTotal_bytes - node_memory_MemFree_bytes) / node_memory_MemTotal_bytes > 0.8
    for: 5m
    labels:
      severity: warning
    annotations:
      summary: "High memory usage detected on {{ $labels.instance }}"
<YAML END>
Reload Prometheus: After defining your alerts, reload Prometheus to apply them.
Integrate with Alertmanager: Prometheus pushes alerts to Alertmanager, which then manages those alerts, including silencing, inhibition, aggregation, and sending out notifications via methods like email, Slack, and more.
Integrating Alerts with Microsoft Teams
While it's great to have alerts within Prometheus and visual cues within Grafana, sometimes you need these alerts to be pushed to your team's communication platform. Microsoft Teams, being one of the popular collaboration tools, can be directly integrated with Prometheus alerts using the Alertmanager.
Example Alert Configuration for Microsoft Teams
Here's an example of an alerting rule in Prometheus that notifies of high memory usage:
<YAML START>
groups:
- name: teams-example
  rules:
  - alert: HighMemoryUsage
    expr: (node_memory_MemTotal_bytes - node_memory_MemFree_bytes) / node_memory_MemTotal_bytes > 0.8
    for: 5m
    labels:
      severity: warning
    annotations:
      summary: "High memory usage on {{ $labels.instance }}"
      description: "{{ $labels.instance }} memory usage is above 80% (current value: {{ $value }})"
<YAML END>
Once the alerting rule is set in Prometheus, the next step is to configure Alertmanager to forward these alerts to Microsoft Teams.
Your Alertmanager configuration would look something like this:
<YAML START>
route:
  group_by: ['alertname', 'cluster', 'service']
  receiver: 'msteams-notifications'
receivers:
- name: 'msteams-notifications'
  msteams_configs:
  - webhook_url: 'YOUR_MICROSOFT_TEAMS_WEBHOOK_URL'
Replace YOUR_MICROSOFT_TEAMS_WEBHOOK_URL with your actual Teams Incoming Webhook URL.
<YAML END>
How Does it Work?
Setting Up Microsoft Teams: First, you need to set up an 'Incoming Webhook' for your Microsoft Teams channel. This will provide you with a webhook URL, which will be used to push notifications to that specific channel.
Configuring Alertmanager: Using the above Alertmanager configuration, when Prometheus fires an alert that meets the defined criteria (in our case, high memory usage), Alertmanager will forward this alert to the specified Microsoft Teams channel.
Receiving Alerts: Once everything is set up, your team will start receiving alerts directly in the Microsoft Teams channel, ensuring rapid response to potential issues.
By integrating Prometheus alerts with Microsoft Teams, you ensure that critical alerts are not just visible to someone monitoring Grafana dashboards but are actively pushed to your team, fostering rapid action and collaboration.
Best Practices
Keep it Simple: It's tempting to add numerous metrics to a dashboard, but clarity often trumps complexity. Start with essential metrics, and expand as necessary.
Use Descriptive Naming: Ensure your metrics and panels are named descriptively. This aids in faster troubleshooting.
Organize with Folders: As you scale, you'll have many dashboards. Use Grafana's folder feature to categorize them.
Interactive Legends: In Grafana, legends (metric names) can be interactive. Use them to toggle metrics on/off for focused analysis.
Consistent Color Coding: Maintain consistent colors for specific metrics across all dashboards. It helps in quicker identification.
Alert Thresholds: On graphs, use visual thresholds or lines indicating at which point an alert would trigger. It provides context to spikes and drops.
Conclusion
Monitoring is not just about collecting data but transforming this data into actionable insights. Grafana and Prometheus, when used effectively, provide a holistic view of an application's health and performance. Integrating with platforms like Microsoft Teams further amplifies this capability, bolstering real-time responses and swift action on these insights. By understanding your metrics, crafting effective dashboards, and setting up informed alerts, combined with alert integrations like Microsoft Teams, you can preemptively address issues, ensure uptime, and maintain a high-quality user experience while ensuring seamless application performance.
Read our latest Blogpost
