KubeOps PLATFORM

Maximum security and compliance for KRITIS applications

KubeOps PLATFORM is the solution for demanding applications in critical infrastructure areas (KRITIS) and places the highest value on security and data protection standards. Specially designed for the efficient provision, management and scaling of Kubernetes clusters, it strictly complies with GDPR regulations as well as ISO 27001 and ITIL requirements. With this strong focus on security and compliance, KubeOps positions itself as the preferred choice for use in sensitive and critical environments.

Simplifying Secure Kubernetes Clusters

deployment, management and scaling

KubeOps Platform involves all the activities required to run, manage and maintain Kubernetes clusters in production environments, including our best practices, self-deployed tools and strategies. 

high level security

KubeOps Platform sets up your clusters with a strong focus on security. These clusters can be audited by the German Federal Office for Information Security (BSI).

In addition we take over the operational aspects of your cluster, providing managed service solutions when required.

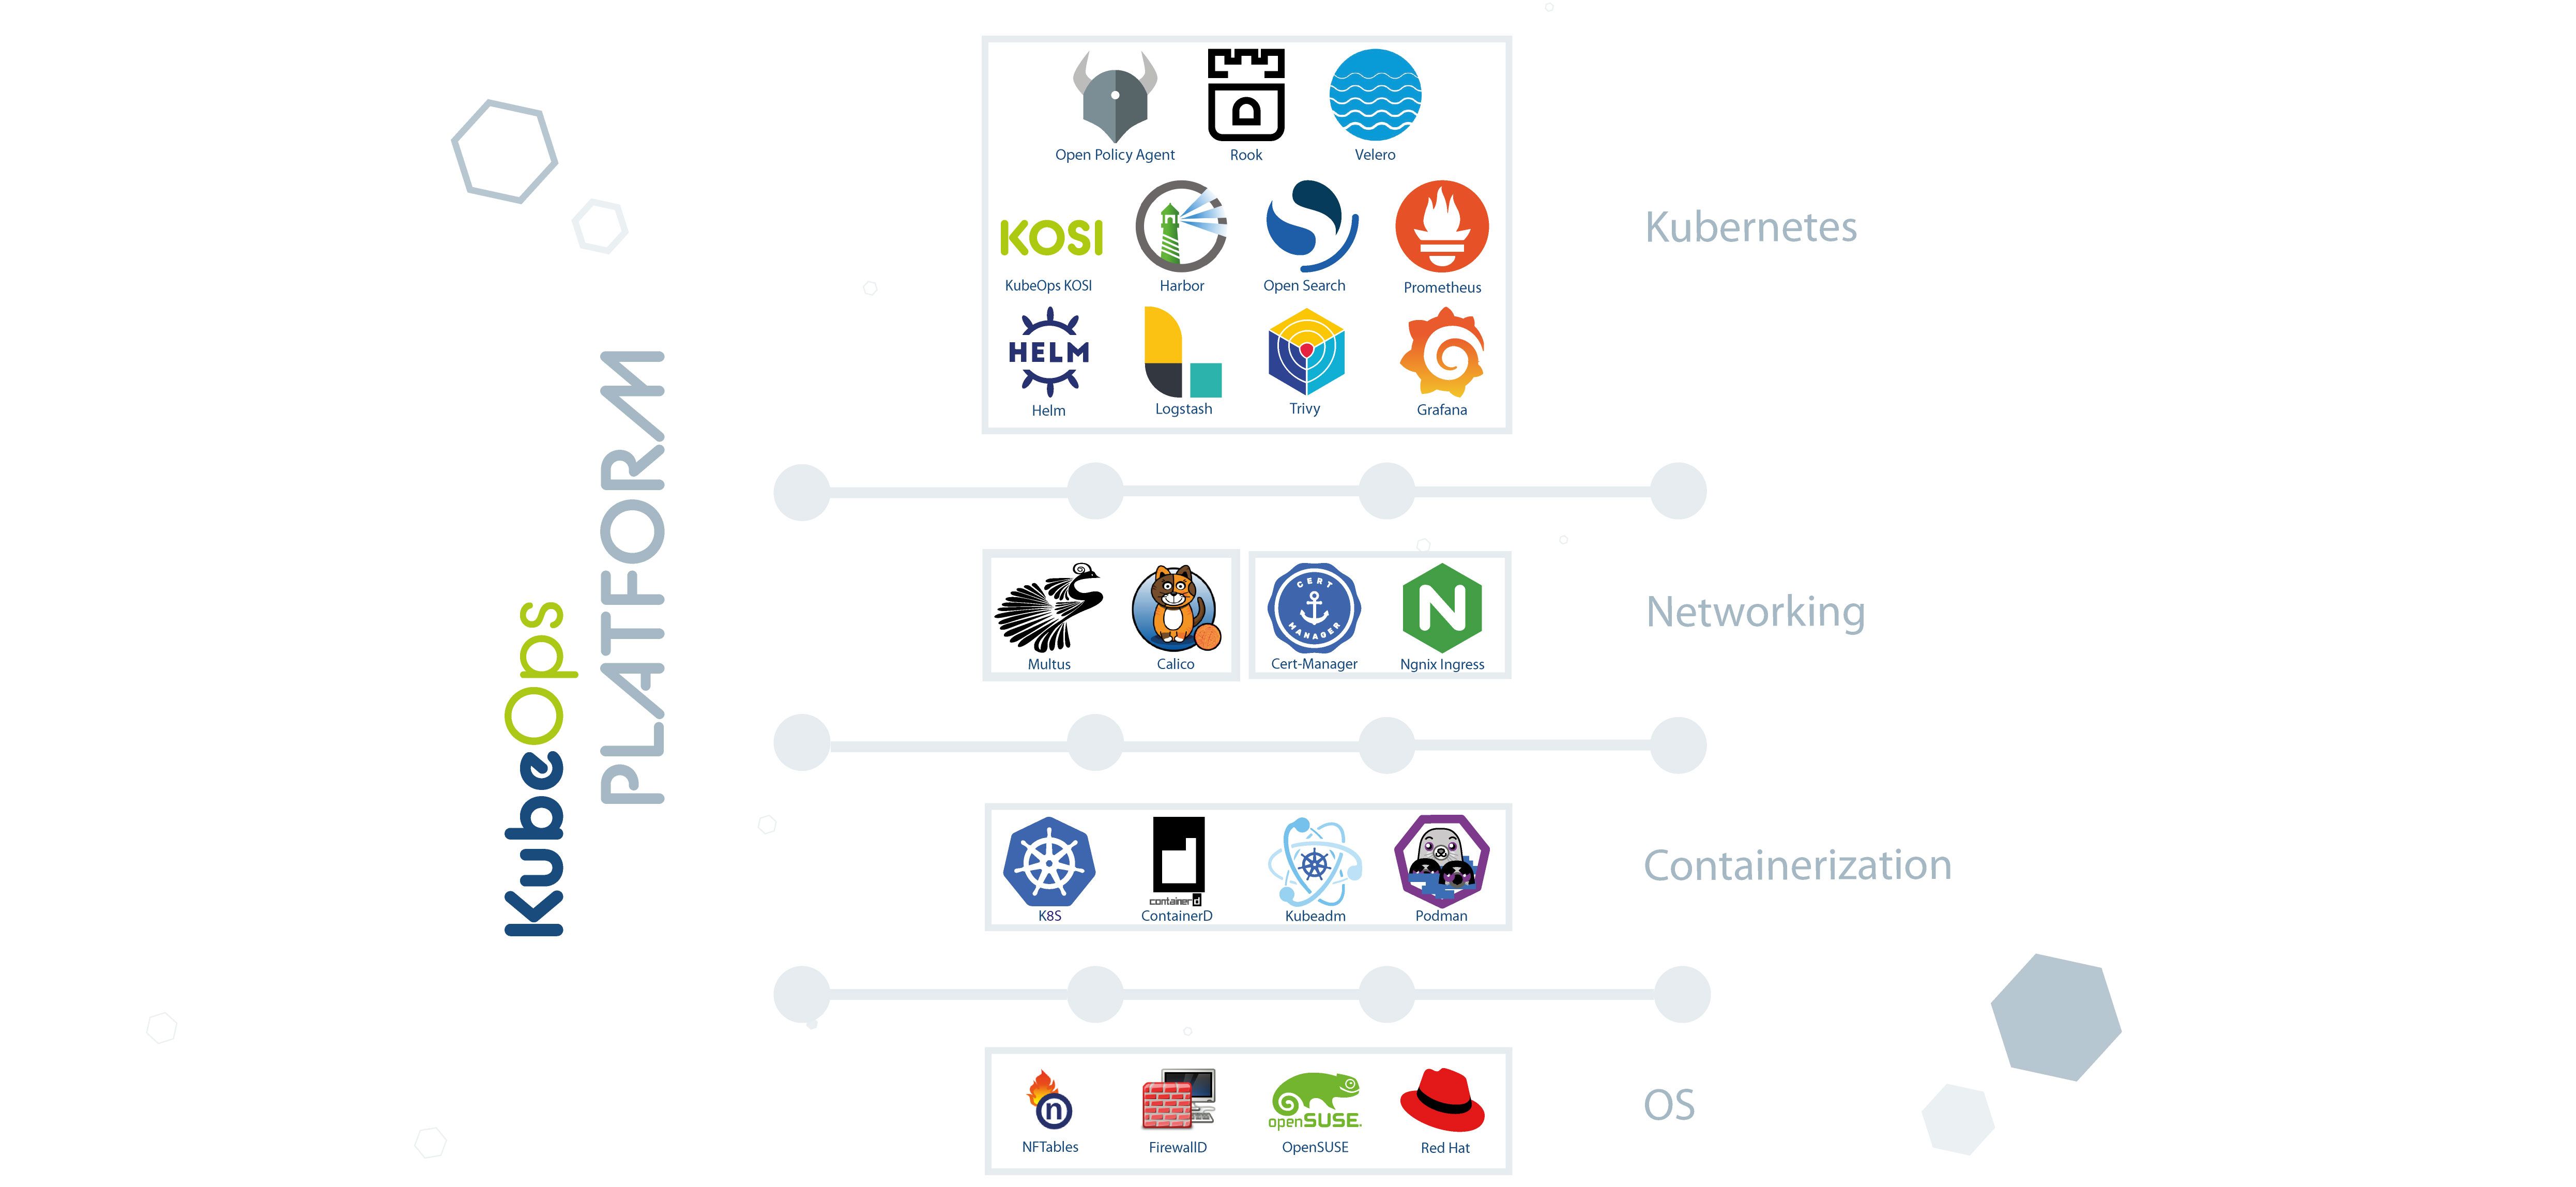
  • The image is a diagram of the "KubeOps Platform" featuring a collection of logos representing various technologies and tools categorized under "Kubernetes", "Networking", "Containerization", and "OS" (Operating System). Each category is delineated by its own row with a colored stripe background where the logos of corresponding tools are placed. The logos symbolize a range of open-source projects and products commonly used in Kubernetes ecosystems, such as Helm, Grafana, Calico, Containerd, and operating systems like openSUSE and Red Hat. The layout is clean, set against a dark blue background with subtle graphic elements that might suggest a digital network or data structure.
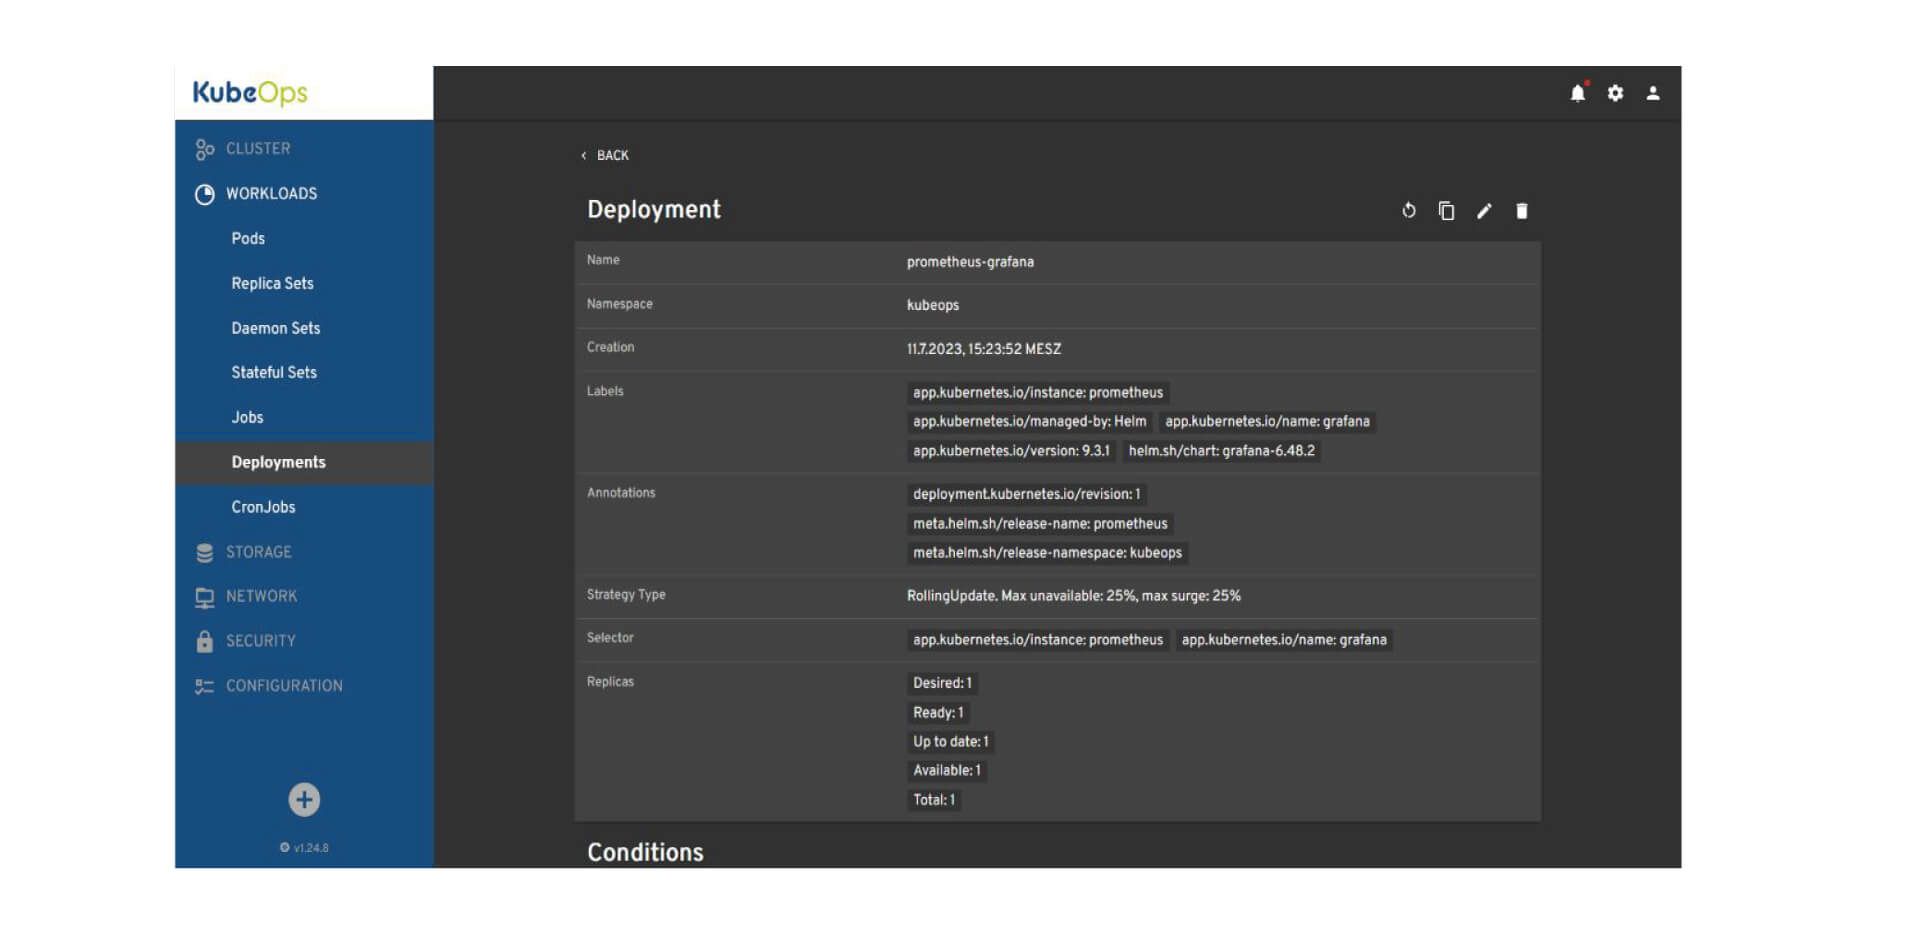
  • The image depicts a user interface of the KubeOps dashboard displaying details of a deployment named "prometheus-grafana". On the left, there's a navigation sidebar with various menu items such as "Cluster", "Workloads", "Storage", "Network", "Security", and "Configuration". The main panel shows the deployment's name, namespace as 'kubeops', creation timestamp, labels, annotations, strategy type 'RollingUpdate', selector, and replica details indicating one desired, ready, up-to-date, available, and total replica. The interface has a dark theme with text and icons in light colors for contrast.


    Detailed view of a Prometheus-Grafana deployment in the KubeOps Dashboard.

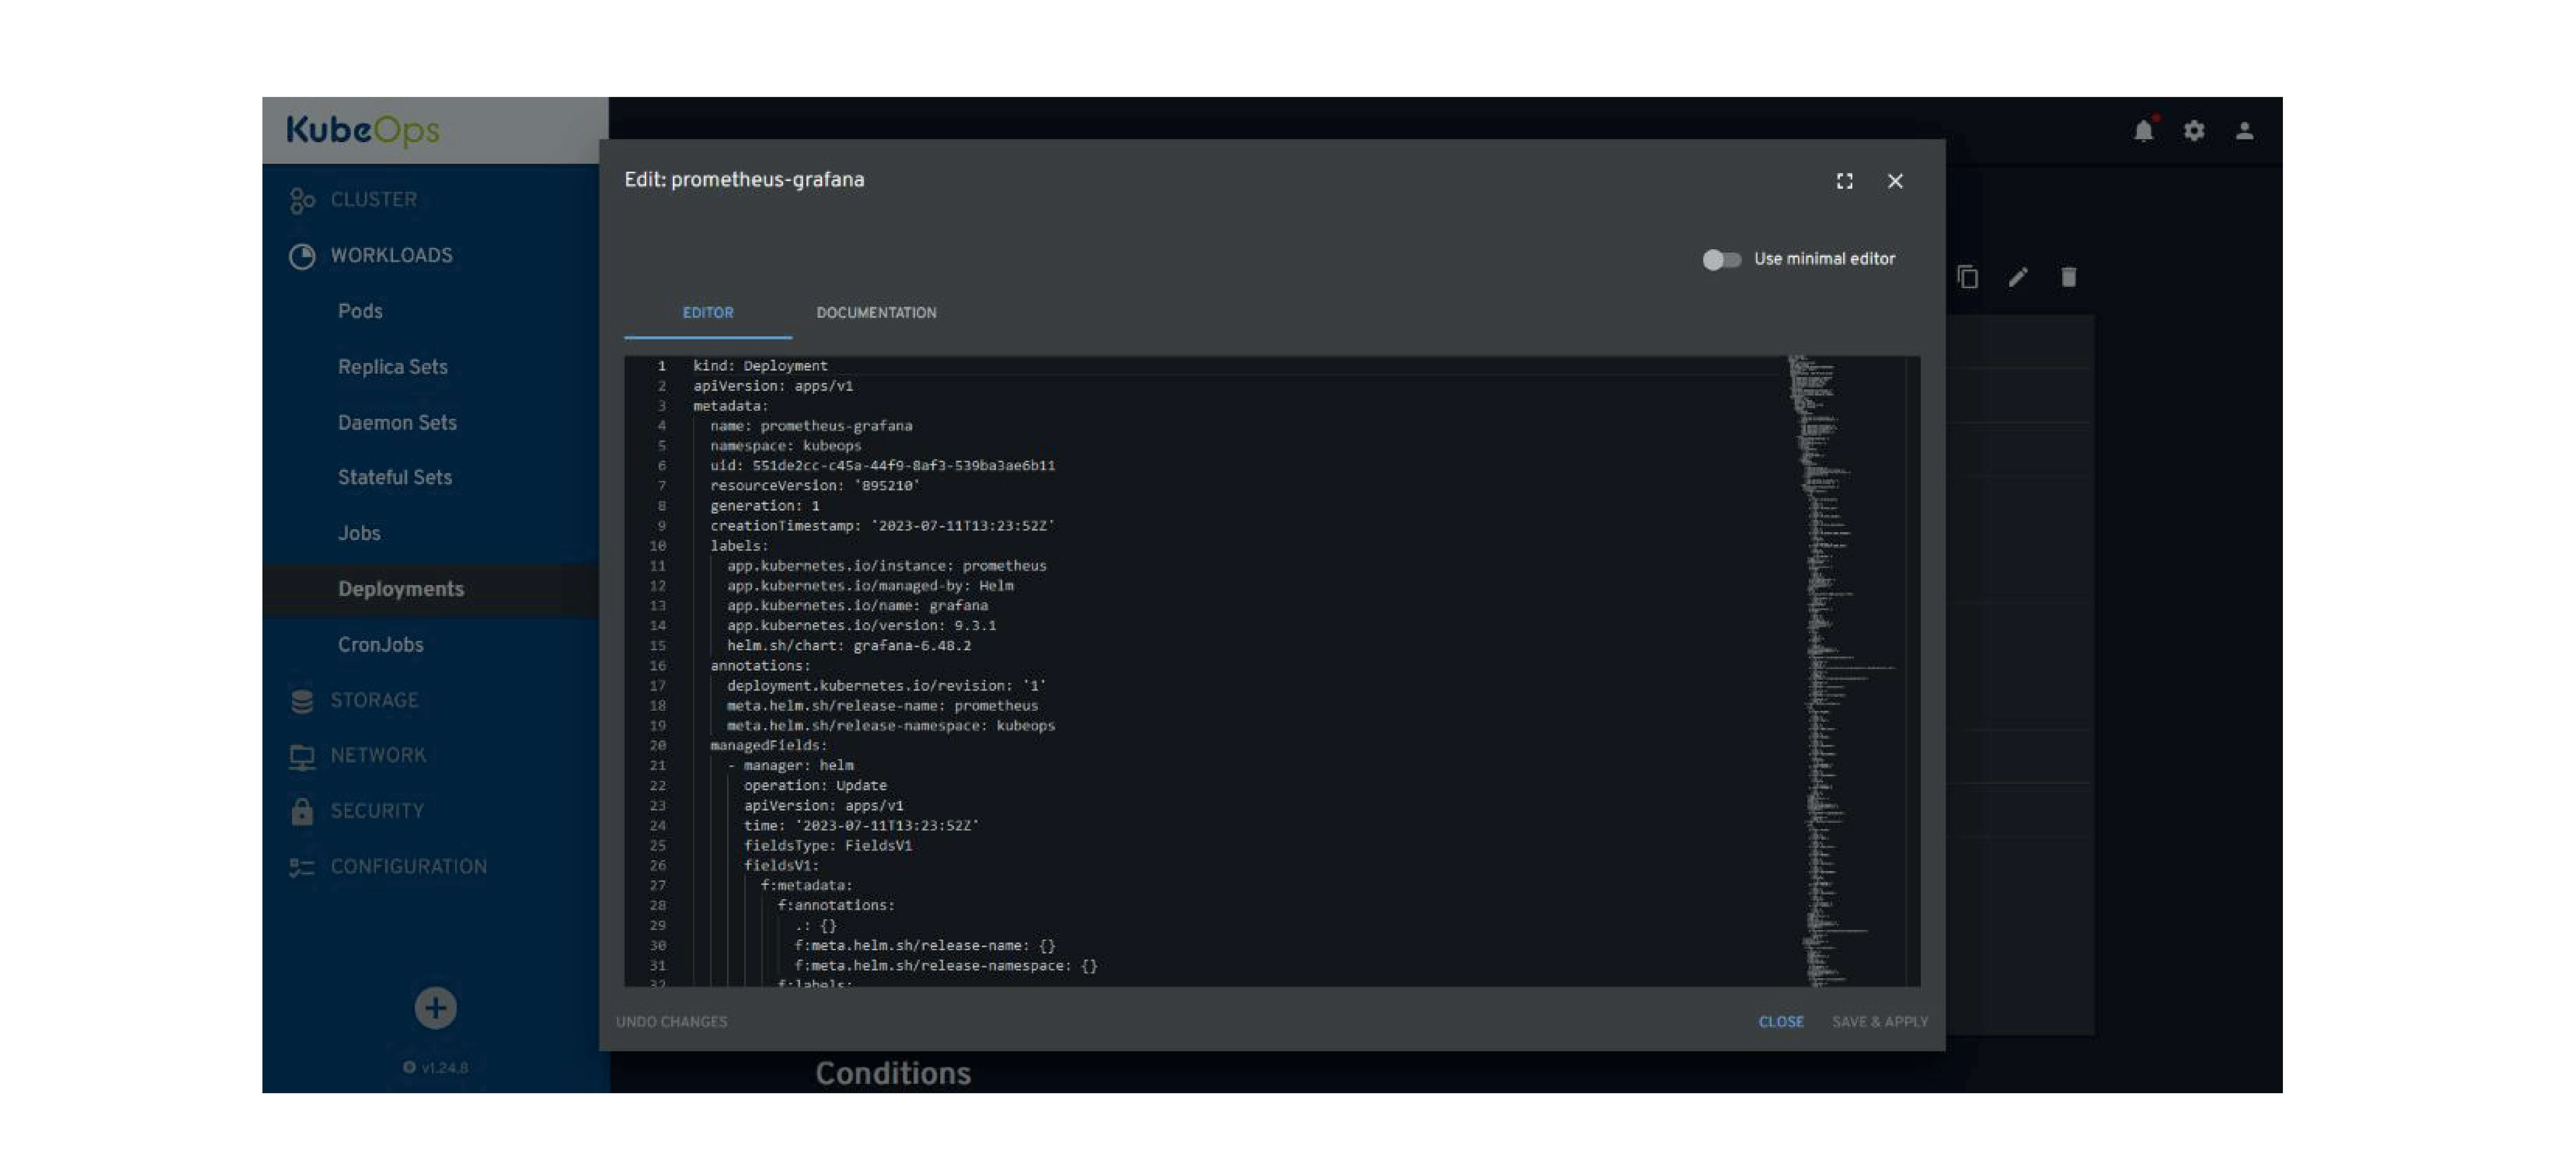
  • The image displays a KubeOps user interface screen for editing the deployment configuration of "prometheus-grafana". The left side shows a navigation bar with options for "Cluster", "Workloads", which includes "Pods", "Replica Sets", "Daemon Sets", "Stateful Sets", "Jobs", "Deployments", "CronJobs", and sections for "Storage", "Network", "Security", and "Configuration". The main panel is an editor window with YAML code detailing the deployment settings such as the kind, API version, metadata, labels, and annotations specific to Helm management. The YAML code includes sections for metadata like name, namespace, labels, and annotations including release names and namespaces managed by Helm. The interface has a minimalist, dark design with options to "Close", "Save & Apply", and switch to a "minimal editor".


    Editing the deployment configuration in the KubeOps Dashboard.

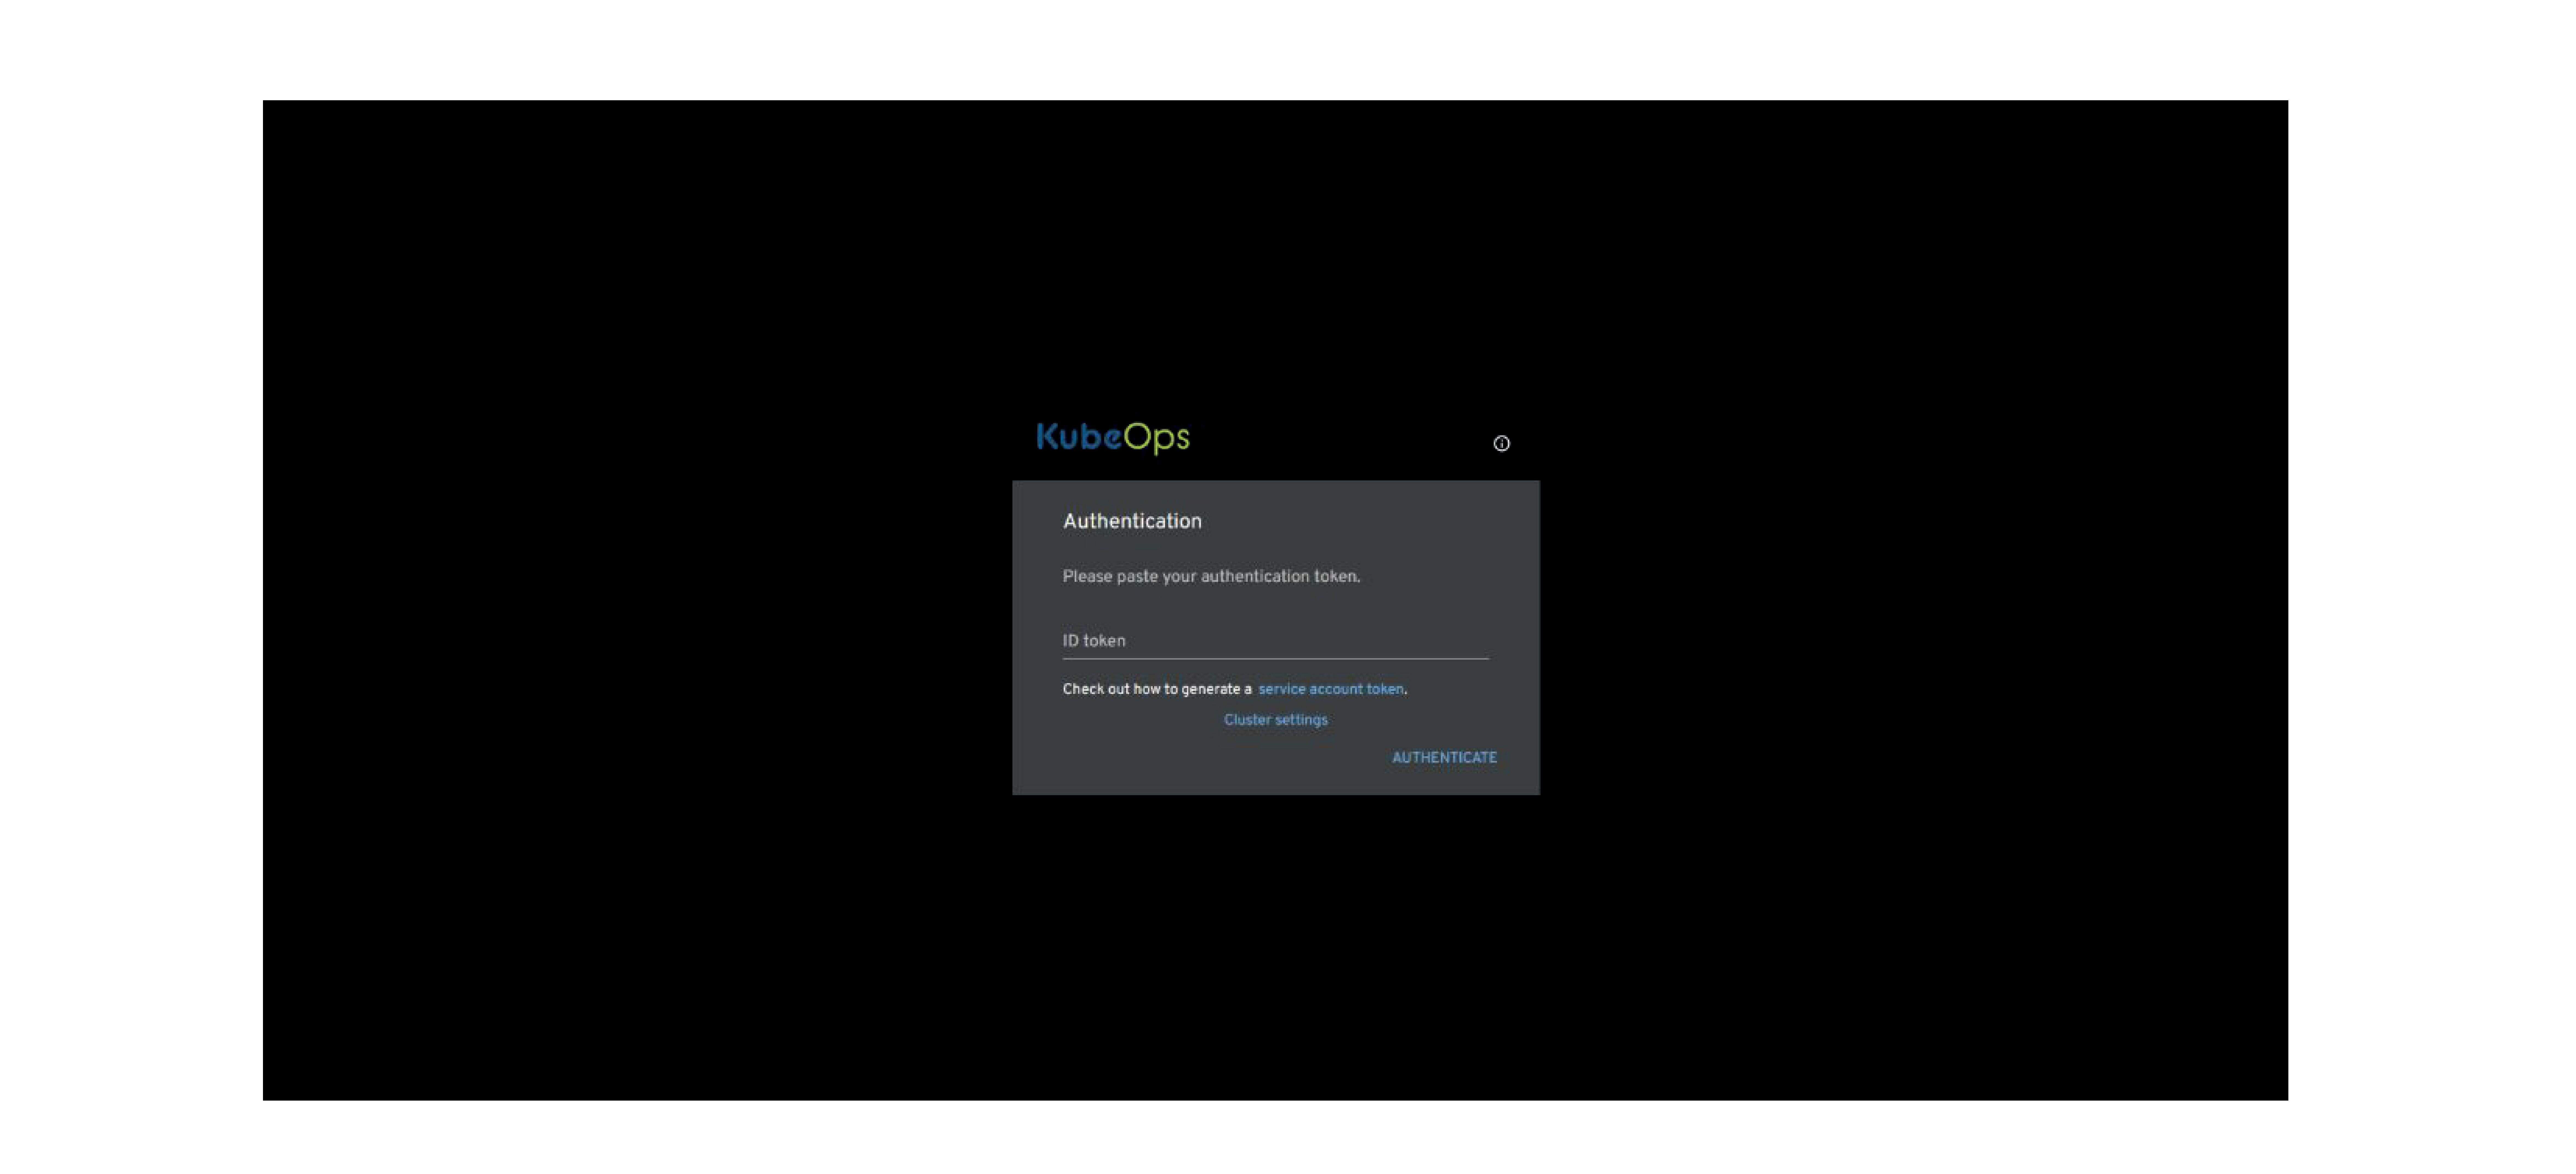
  • The image is a login screen for the KubeOps dashboard, requesting user authentication. It features a dark theme with a central grey box containing the text "Authentication" followed by a prompt to "Please paste your authentication token." Below the prompt is a field labeled "ID token" for input. There's also a link with instructions on "how to generate a service account token, Cluster settings." At the bottom of the box is an "AUTHENTICATE" button. The KubeOps logo is visible at the top left corner of the screen.


    The KubeOps Dashboard is accessible through authentication via ID Token.

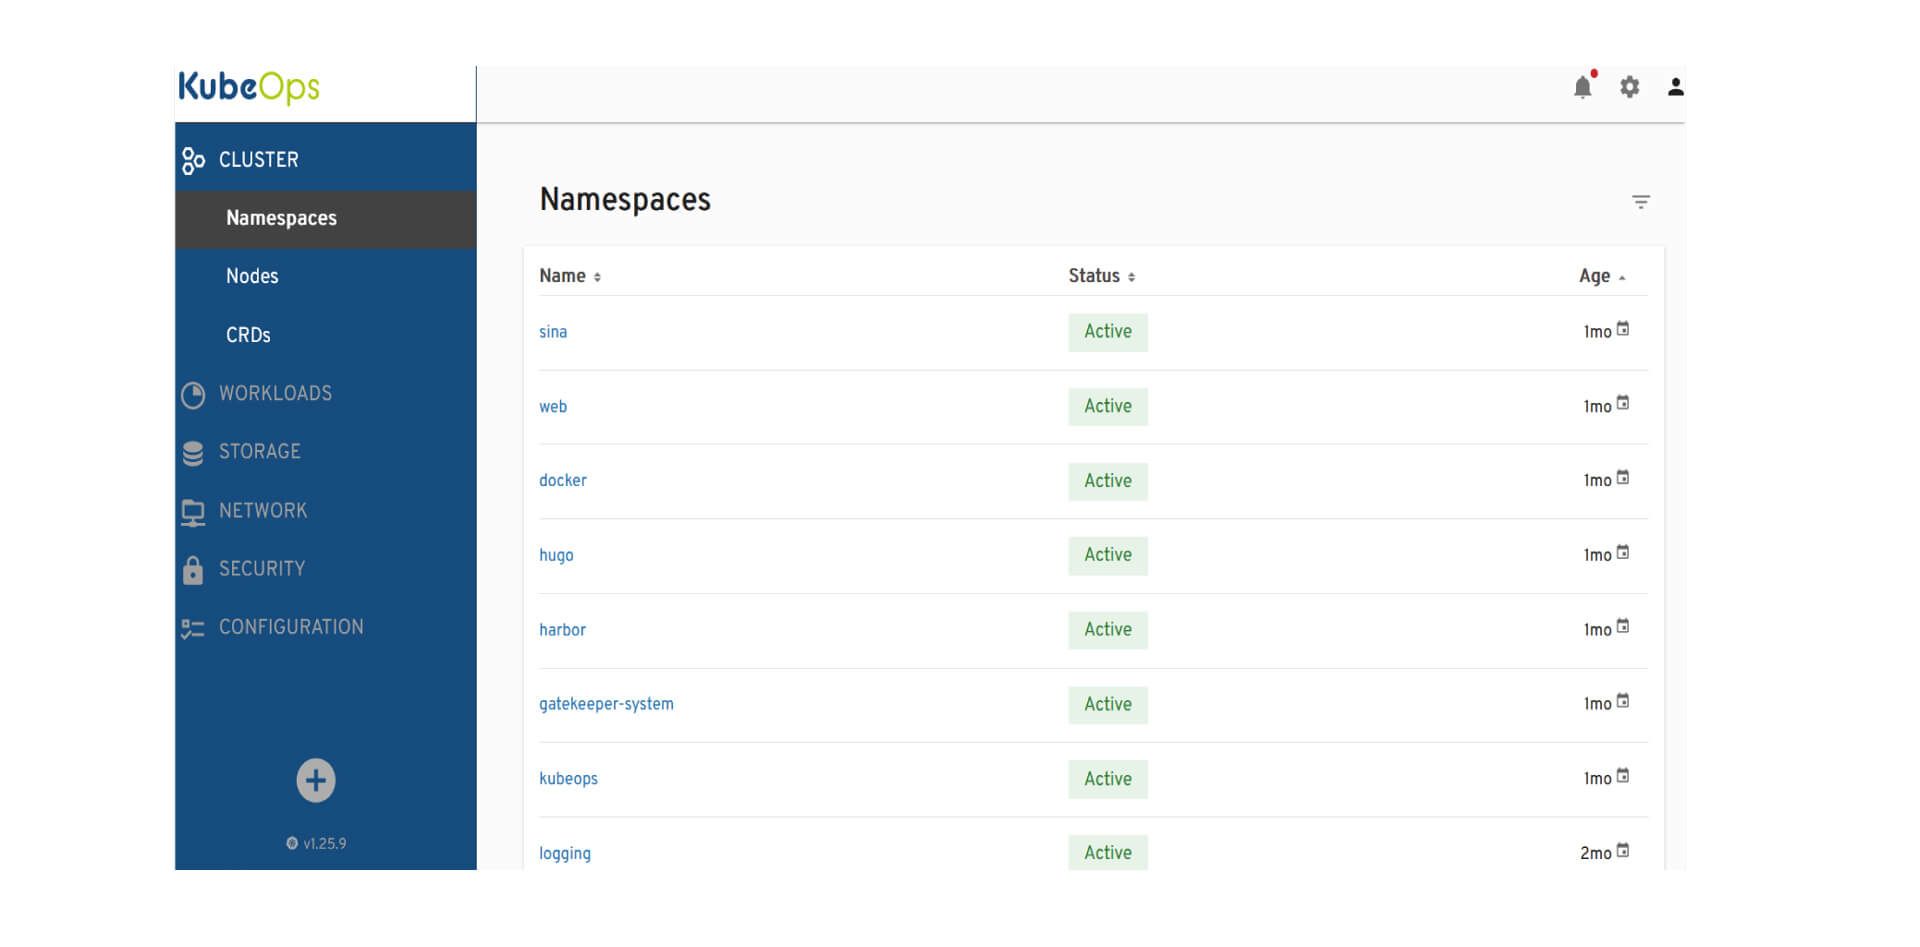
  • The image shows a screenshot of the KubeOps dashboard interface with a focus on the "Namespaces" section within the "CLUSTER" category. The left sidebar is colored in shades of blue, highlighting the active section "Namespaces", and includes other menu items such as Nodes, CRDs, Workloads, Storage, Network, Security, and Configuration, along with the version number of the software at the bottom. The main content area lists Kubernetes namespaces in a table format with columns for "Name", "Status", and "Age". Each row lists a namespace name such as 'sina', 'web', 'docker', with all statuses marked as "Active" and the age varying from "1mo" to "2mo". The interface has a clean, modern look with a light background for the table, making the text easy to read.


    Users can overview and manage namespaces in the KubeOps Dashboard.

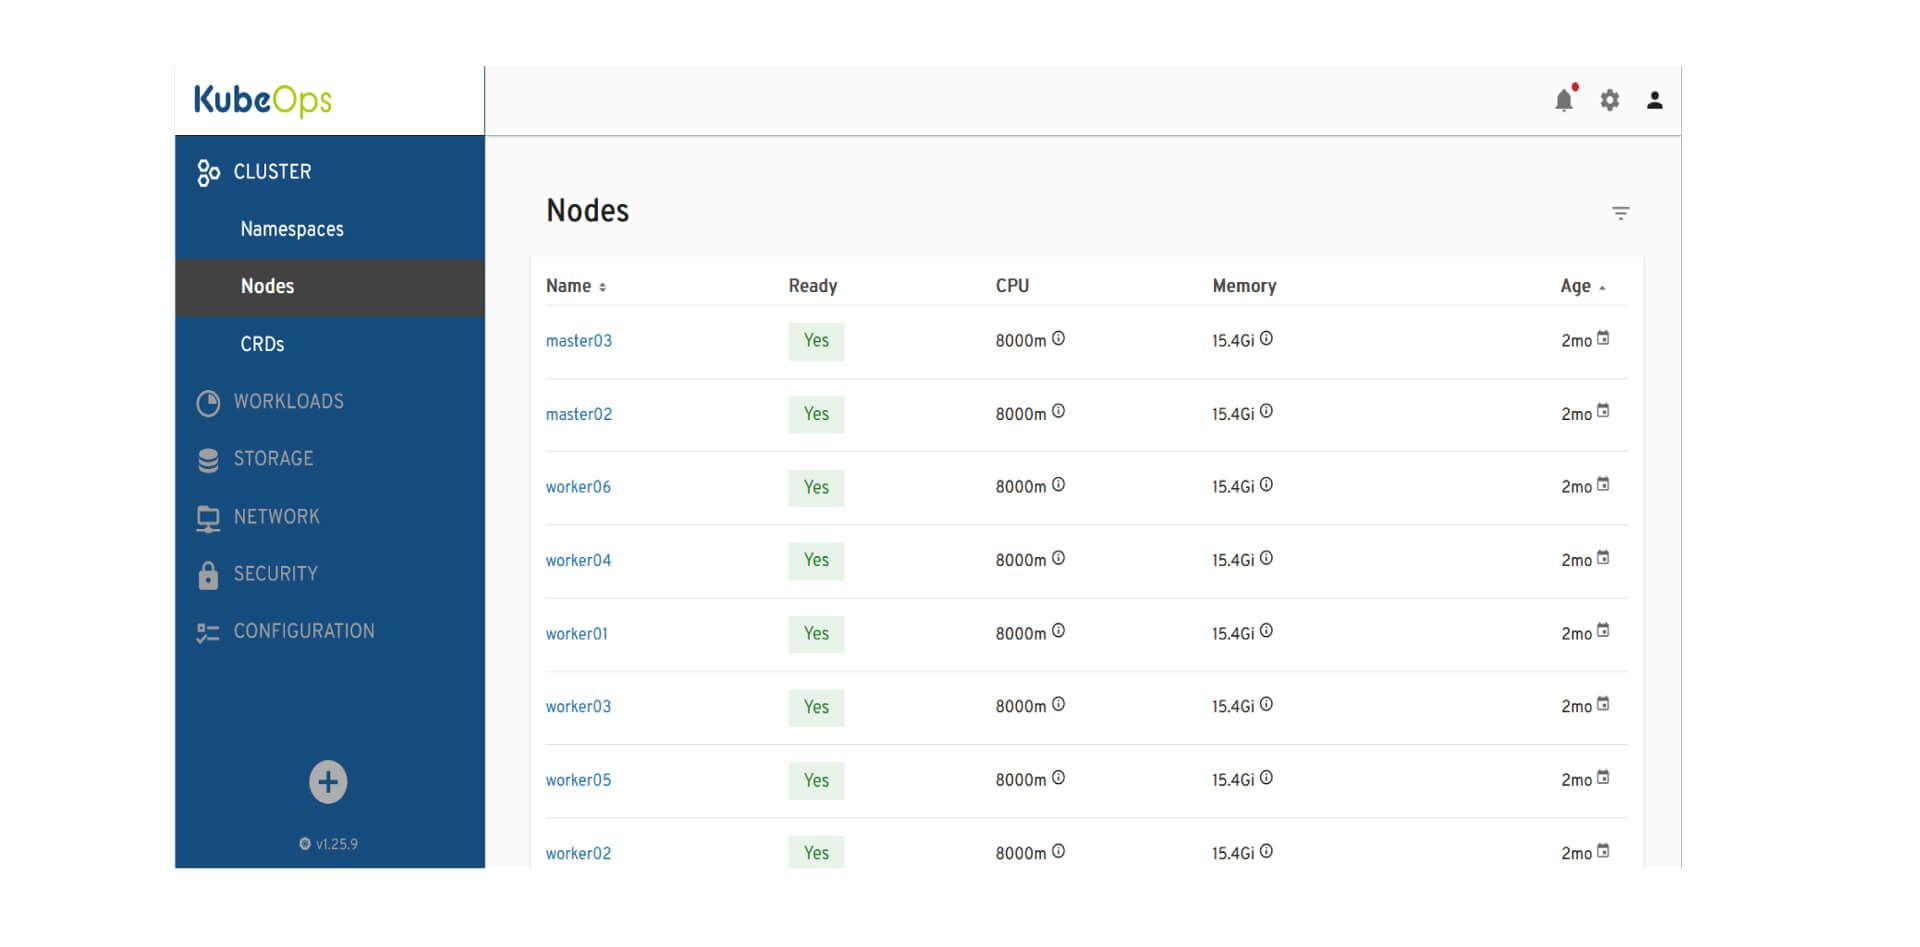
  • The image is a screenshot of the KubeOps dashboard displaying the "Nodes" section of a Kubernetes cluster. The left sidebar highlights the "Nodes" menu item, with other items including "Namespaces", "CRDs", "Workloads", "Storage", "Network", "Security", and "Configuration" listed above and below. The main pane lists Kubernetes nodes with columns for "Name", "Ready" status, "CPU" resources, "Memory" usage, and "Age" of the node. Each node is marked as "Yes" under the Ready column, indicating they are operational, with CPU resources allocated at 8000m and memory at 15.4Gi. The age of all nodes listed is 2 months. The interface has a clean, modern design with a blue and white color scheme.


    Users can monitor and manage the state and performance of cluster nodes.

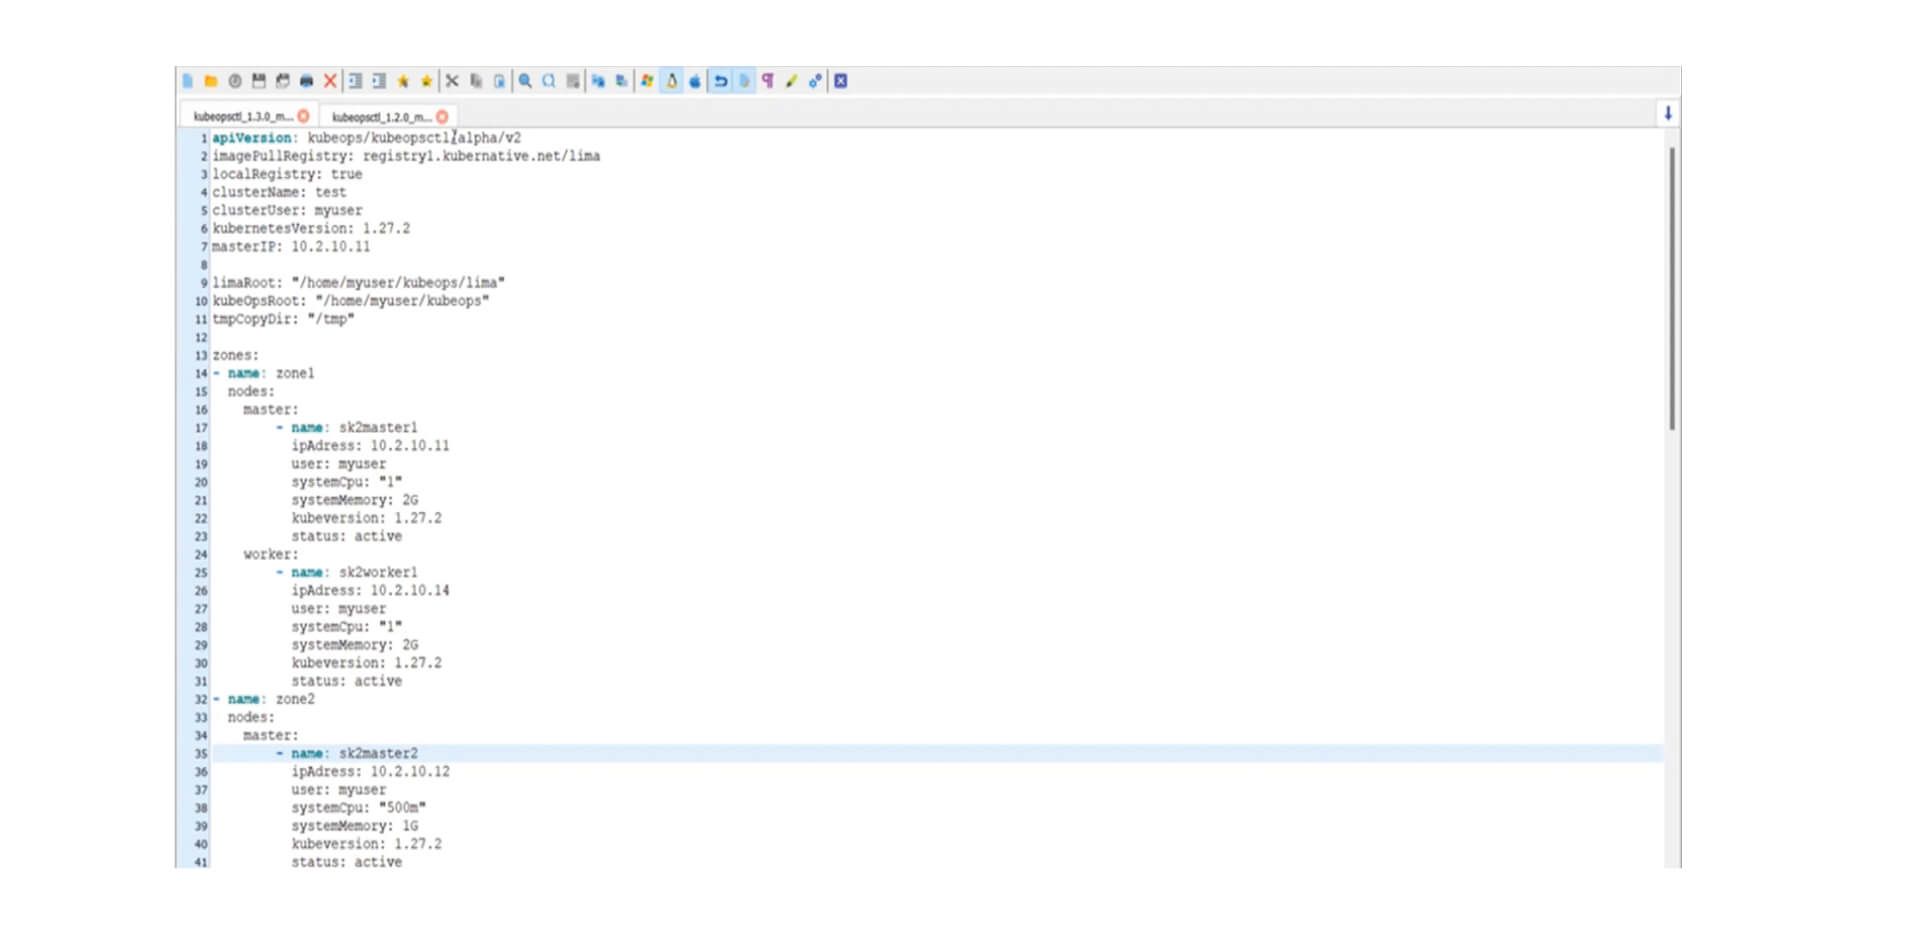
  • The image is a screenshot of a text editor displaying a YAML configuration file for KubeOps. It includes settings for API version, image pull policy, local registry, cluster name, user, Kubernetes version, master IP, paths for Lima and KubeOps roots, and a temporary directory. Additionally, it details two zones with node configurations for masters and workers, specifying names, IP addresses, user names, system CPU and memory resources, Kubernetes version, and status. The text is shown in a classic programming environment with line numbers, and the configuration data is well-organized for easy reading and editing.


    Kubeopsctl enables efficient management and automation of clusters.

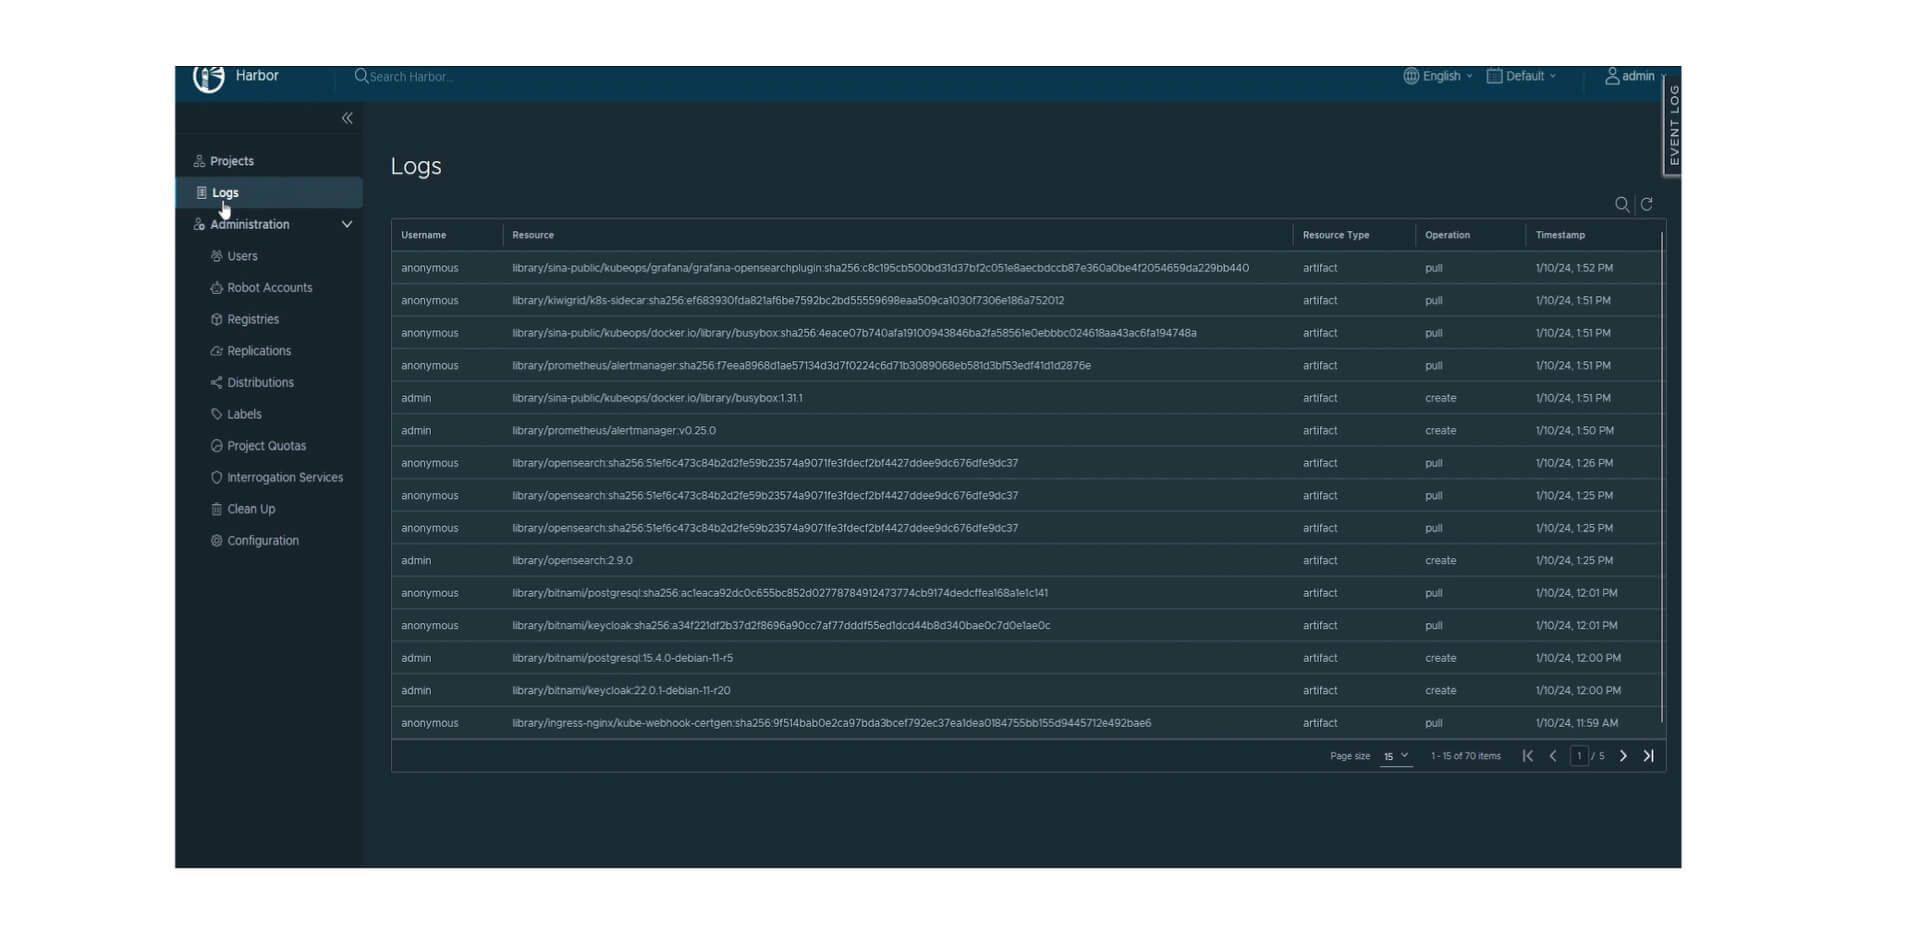
  • The image is a screenshot of the Harbor container registry interface showing the "Logs" section. The left sidebar indicates navigation options such as "Projects", "Logs", "Administration", among others. The main content area lists log entries with columns for "Username", "Resource", "Resource Type", "Operation", and "Timestamp". The logs display a series of pull and create operations performed by users, identified as 'anonymous' and 'admin', on various docker images and artifacts. The interface is shown in dark mode with text and interactive elements in lighter colors, and there are options for language and user settings at the top right corner.


    Harbor Logs for debugging, monitoring, and ensuring compliance.

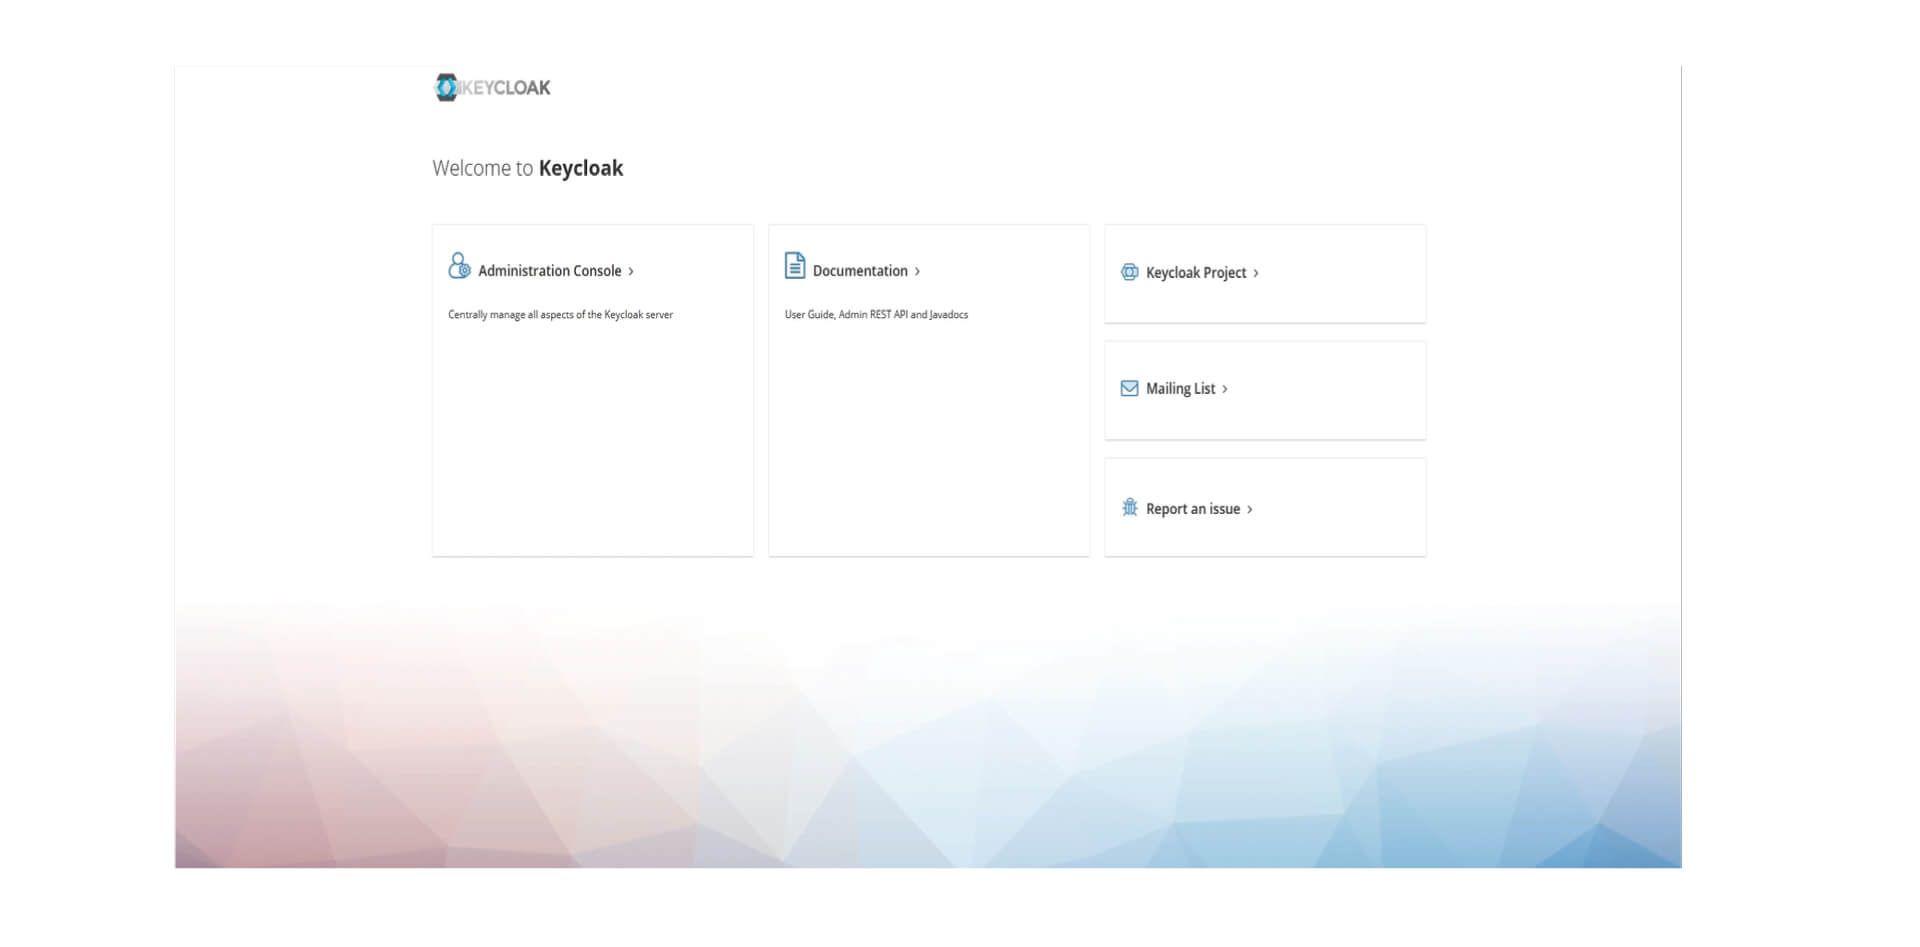
  • The image shows the welcome screen of the Keycloak web application. It displays the Keycloak logo at the top, followed by the greeting "Welcome to Keycloak". Below are four options presented as cards: "Administration Console" with a subtitle "Centrally manage all aspects of the Keycloak server", "Documentation" offering "User Guide, Admin REST API and Javadocs", "Keycloak Project" leading to more information about the project, and "Mailing List" to subscribe to updates. The last card, "Report an issue", invites users to report problems. The layout is clean with a minimalist design against a soft, abstract background.


    Keycloak as an identity management system and central access to dashboards.

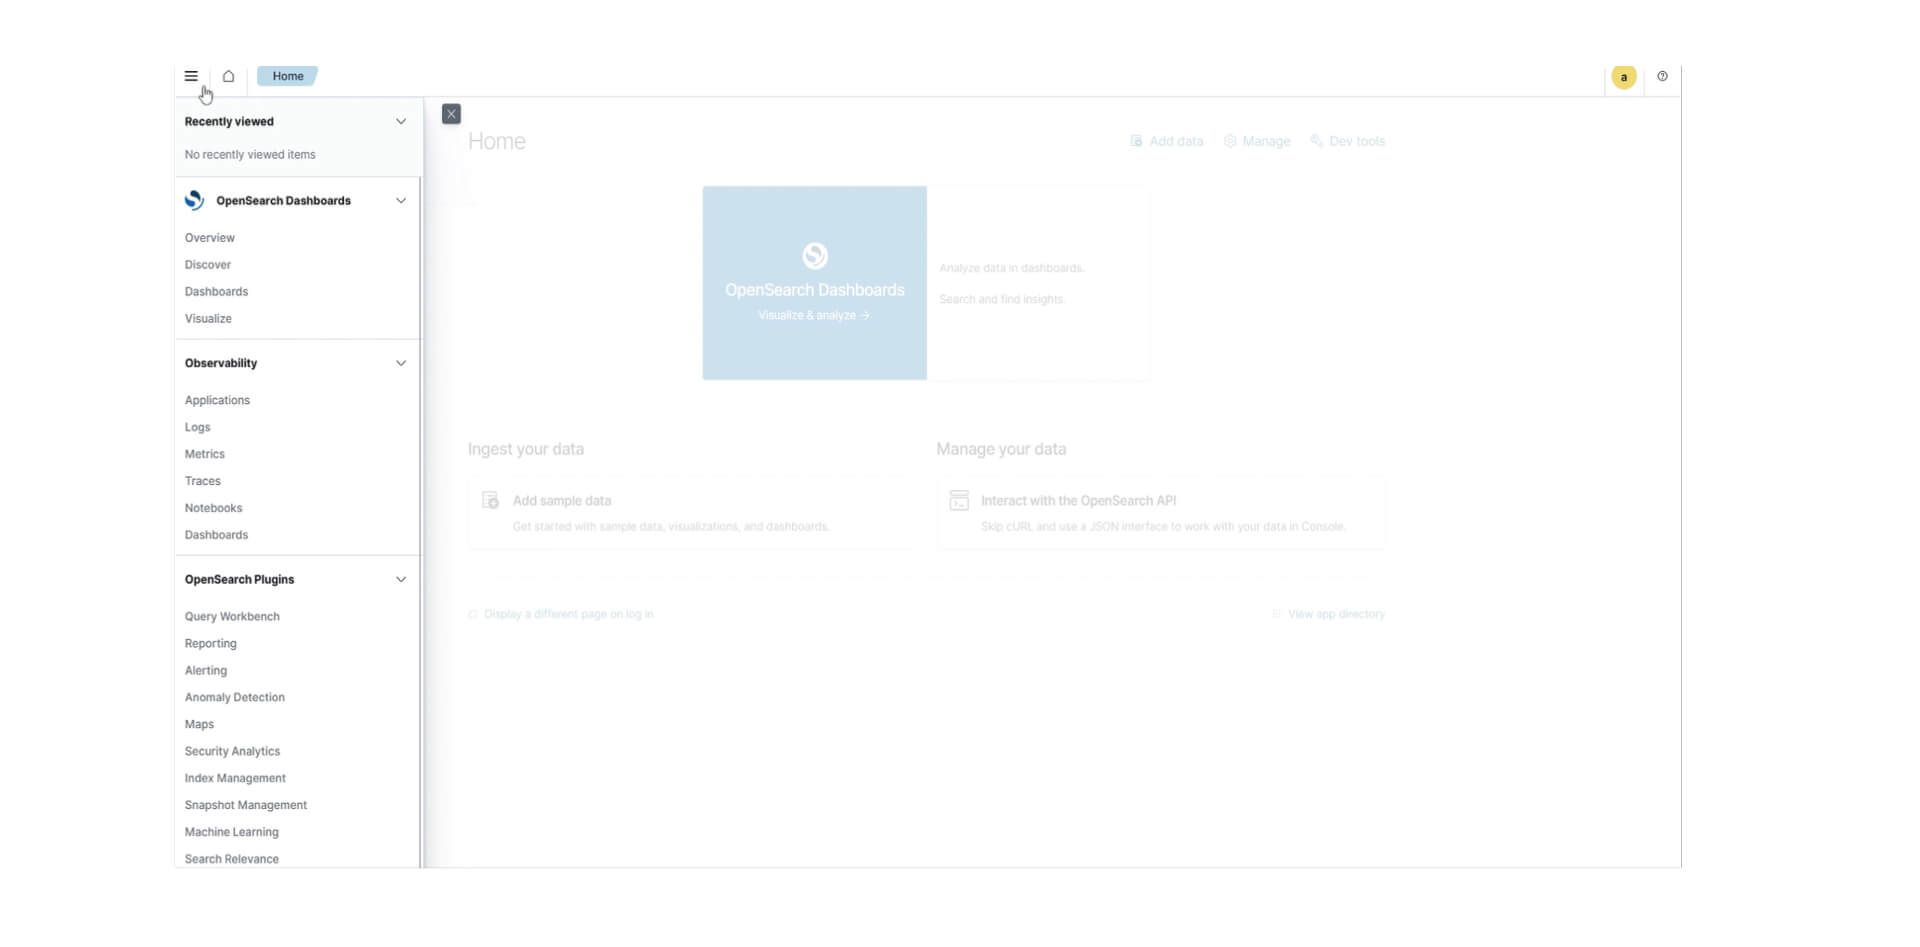
  • The image is a screenshot of the OpenSearch Dashboards homepage. The interface includes a left-hand navigation panel with sections for "Recently viewed", "OpenSearch Dashboards", and "Observability". Underneath, there is a section for "OpenSearch Plugins" with various options like "Query Workbench", "Reporting", "Alerting", and more. The main content area displays three boxes: one for "OpenSearch Dashboards" with a subtext about analyzing data, a second box for adding sample data to get started with data, visualizations, and dashboards, and a third box providing an option to interact with the OpenSearch API. The design is clean with a white and light blue color scheme, and the top of the page has a search bar, home button, and user account access.


    The OpenSearch Dashboard enables users to visualize and analyze data.

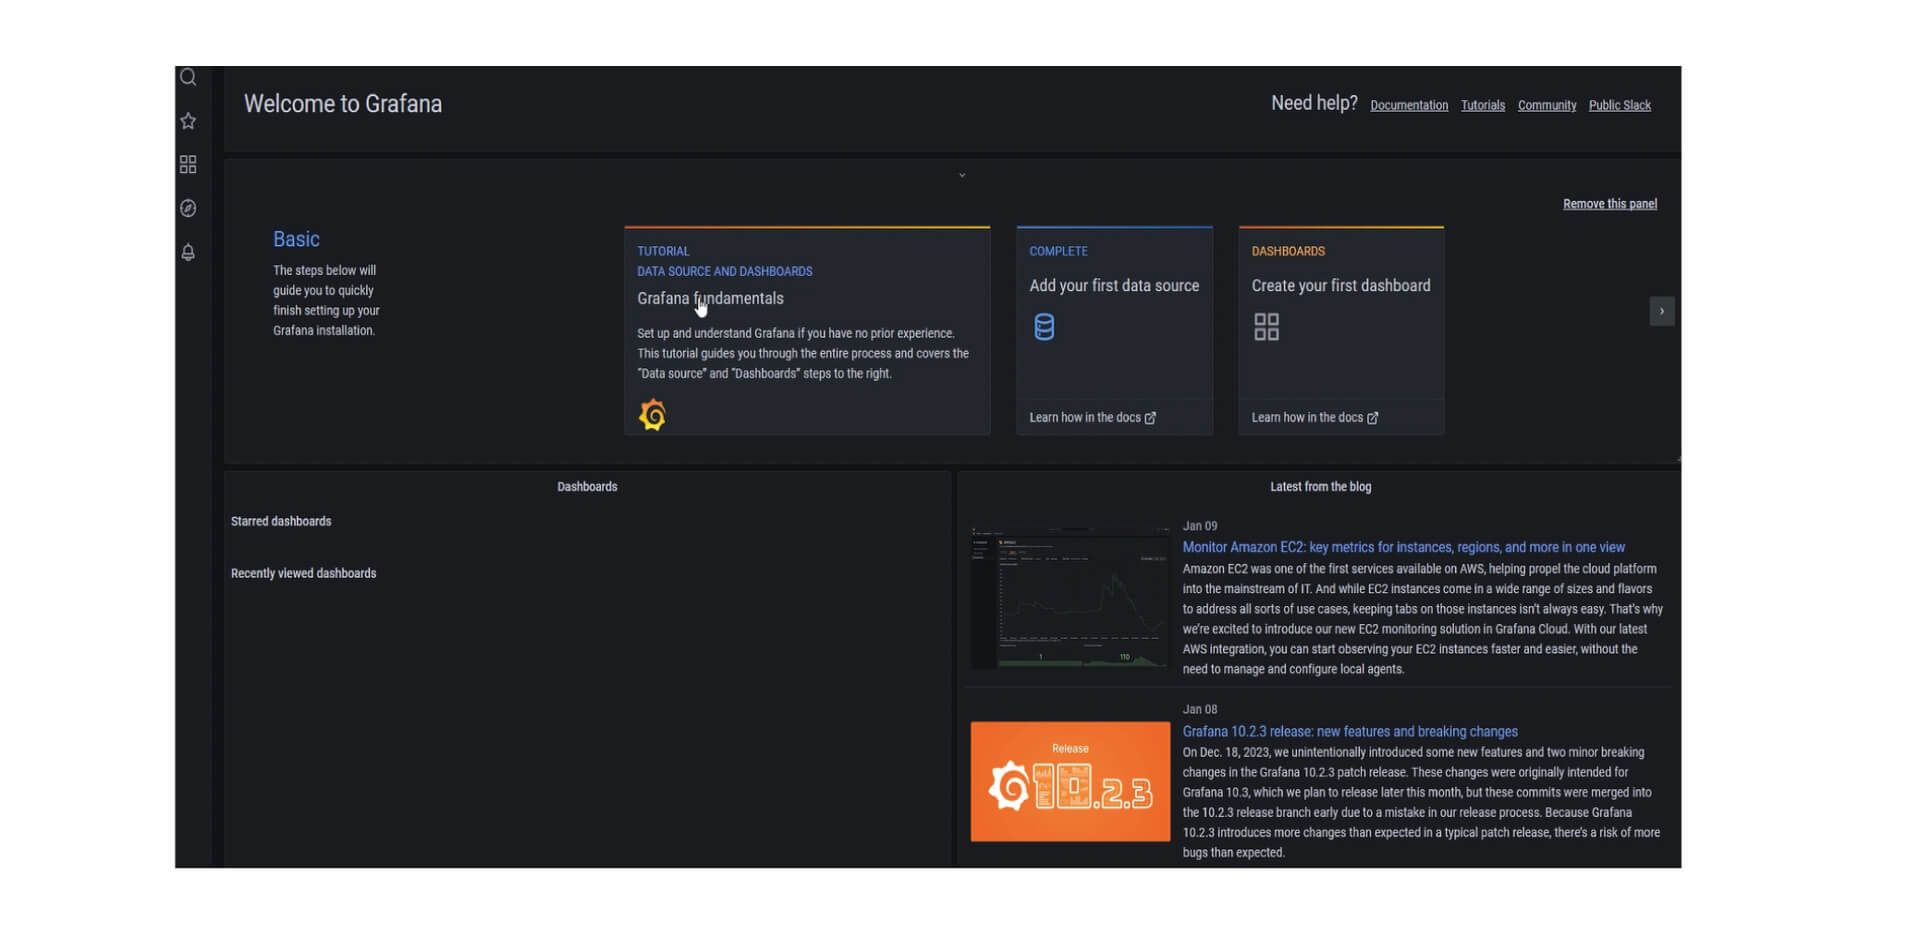
  • The image is a screenshot of the Grafana dashboard home page. It features a welcoming message and a black sidebar on the left with options like "Starred dashboards" and "Recently viewed dashboards". In the main content area, there are sections titled "Basic", with steps to set up Grafana, a "Tutorial" on Grafana fundamentals, and boxes for "Add your first data source" and "Create your first dashboard" with corresponding links to learn more in the documentation. The top bar offers help resources such as "Documentation", "Tutorials", "Community", and "Public Slack". The design is dark-themed with highlighted areas in bright colors to attract attention to key actions for new users.


    Displaying downtimes and setting up alerts with Grafana.

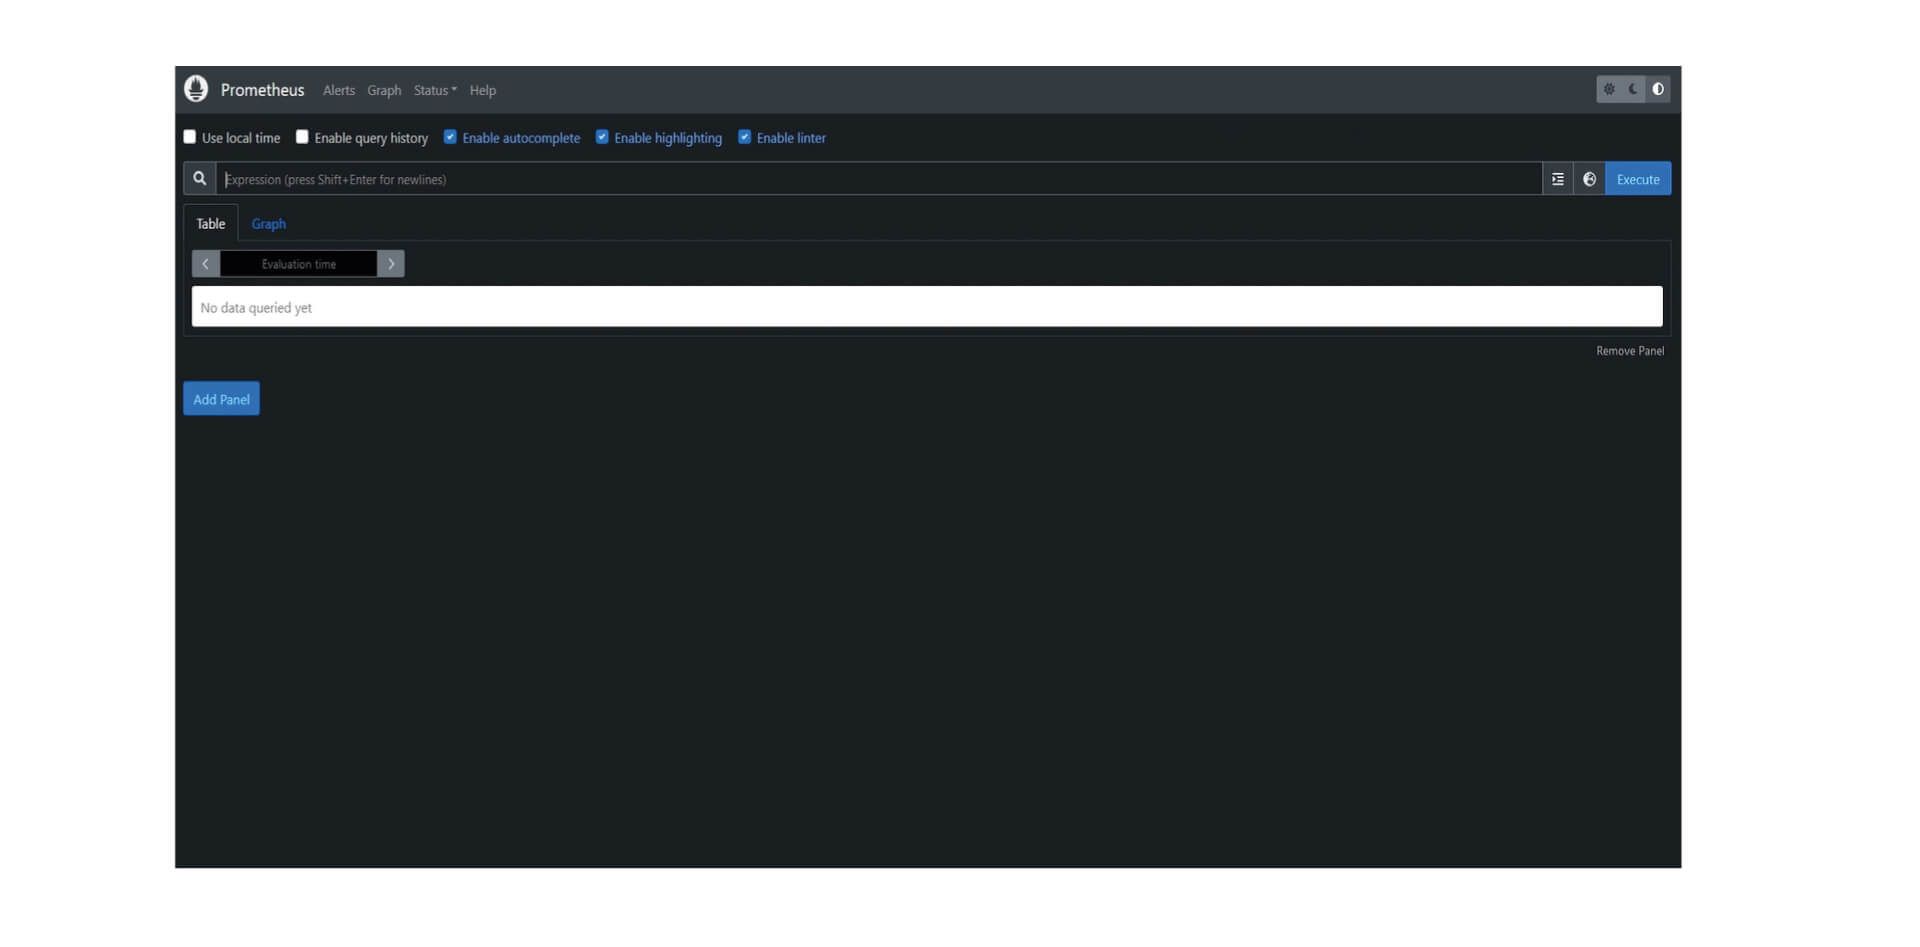
  • The image is a screenshot of the Prometheus web interface. It features a query bar with options to "Use local time", "Enable query history", "Enable autocomplete", "Enable highlighting", and "Enable linter". The interface is predominantly dark with a query input field labeled "Expression (press Shift+Enter for newlines)" and buttons for "Table" and "Graph" views. There is a message stating "No data queried yet" and a button to "Add Panel". The top navigation bar includes tabs for "Alerts", "Graph", "Status", and "Help". The overall layout is clean and utilitarian, designed for entering and evaluating data queries within Prometheus.


    Monitoring and alerting of Kubernetes clusters through Prometheus.

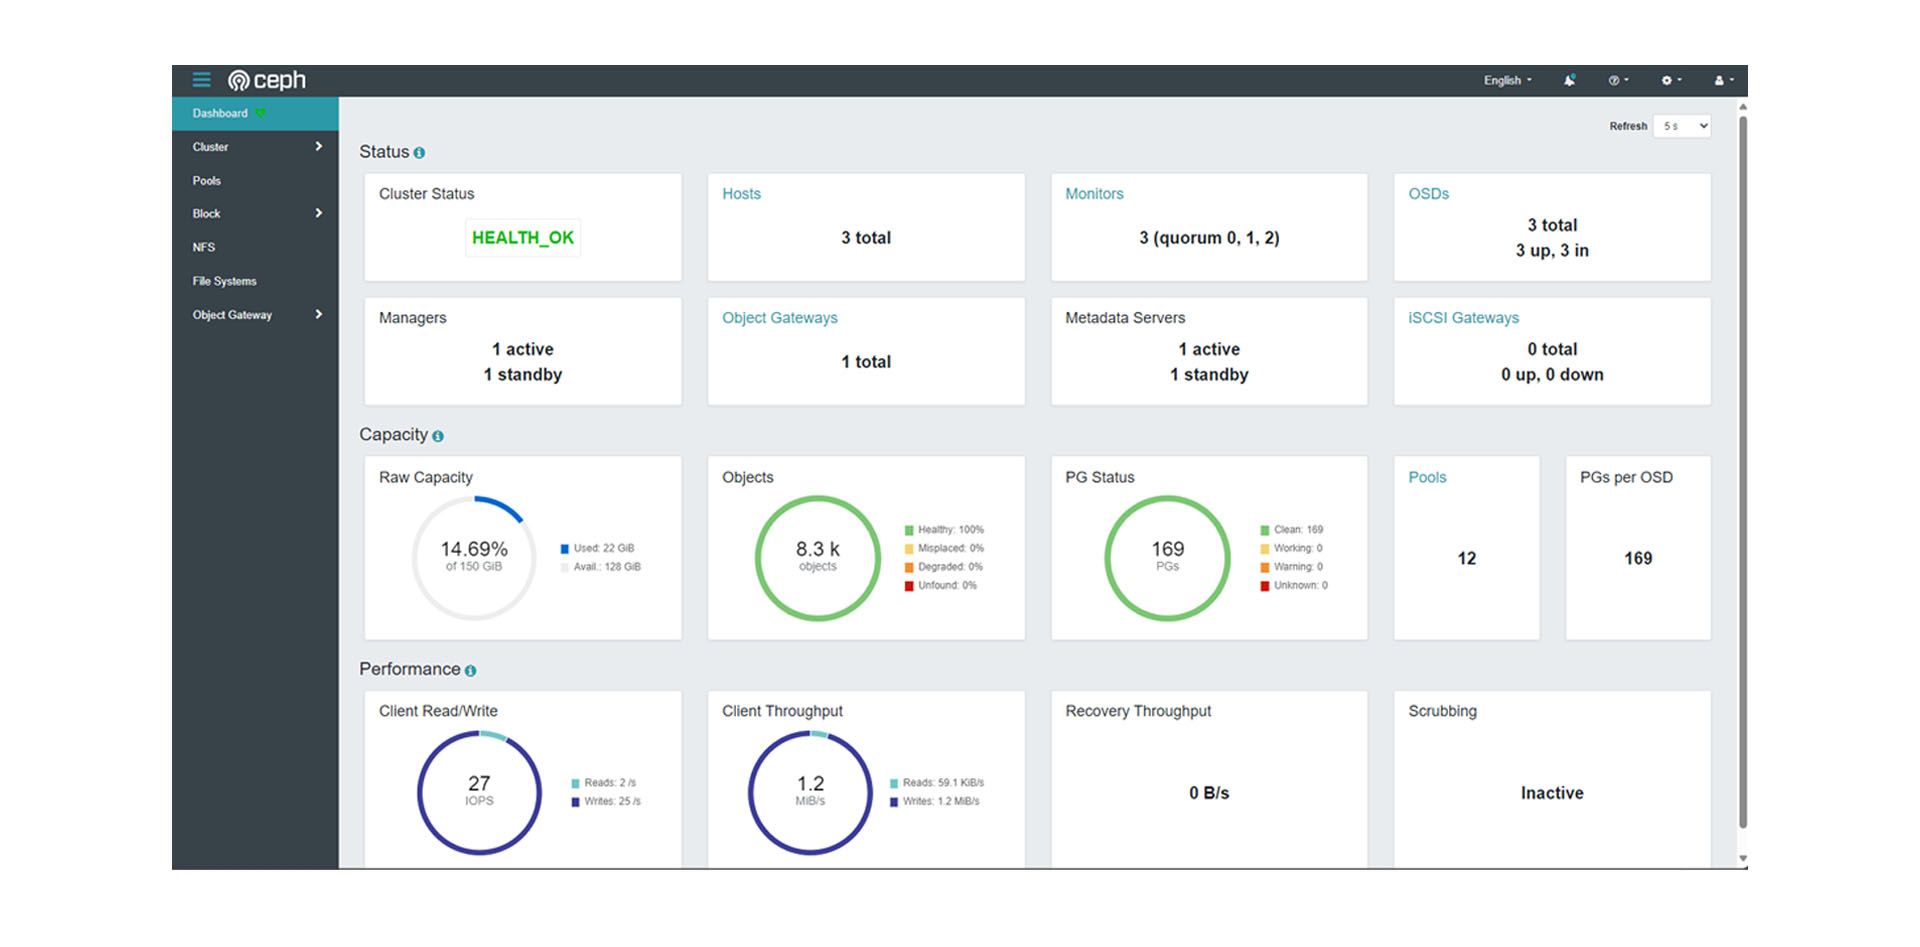
  • The image is a screenshot of a Ceph storage management dashboard. The dashboard displays various metrics and statuses related to the storage cluster. The "Status" section includes a "Cluster Status" indicating a health warning, "Managers" with one active and one in standby, "Hosts" with a total of three, "Monitors" showing three with a quorum, "OSDs" displaying three up and in, and "Object Gateways" and "iSCSI Gateways" both showing zero total. Under "Capacity", there's a gauge showing "Raw Capacity" at 4.34% utilization of 300 GiB. "Objects" and "PG Status" are represented by circular progress bars, showing 5.1k objects and 81 placement groups respectively. The "Performance" section shows "Client Read/Write" and "Client Throughput" with activity graphs, while "Recovery Throughput" is at zero and "Scrubbing" is inactive. The interface is clean with a light background, and data visualizations provide a quick overview of the system's health and performance.


    The Ceph Dashboard allows monitoring of operations and utilization.

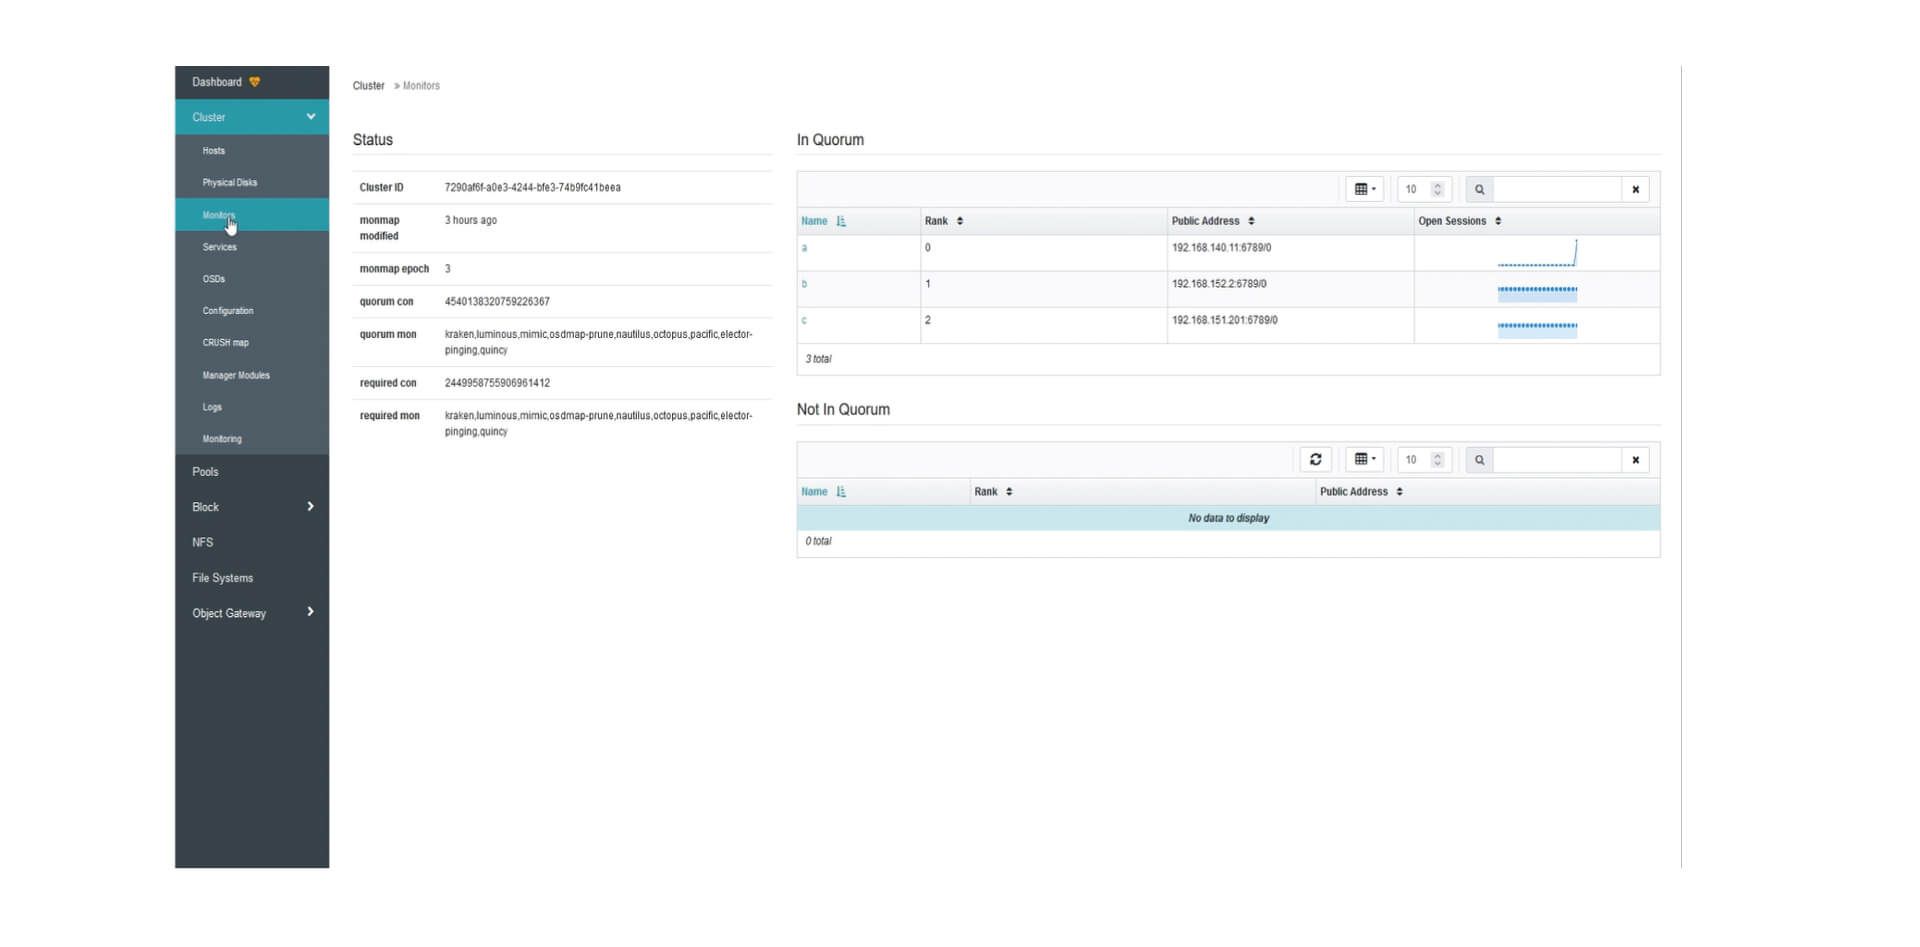
  • The image is a screenshot of the Ceph dashboard focused on the Monitors section. The left sidebar shows navigation options, including "Dashboard", "Cluster", and other management categories such as "Hosts", "Physical Disks", and "Monitors". The main content area is divided into two sections: "Status" on the left, detailing "Cluster ID", "monmap modified", "monmap epoch", "quorum con", "quorum mon", "required con", and "required mon", with respective values and statuses. On the right, there are two tables: "In Quorum", showing monitors named 'a', 'b', 'c' with their ranks, public addresses, and open sessions, and "Not In Quorum", which is empty. The interface is clean with a light background, and the information is presented in a well-organized, tabular format.


    Ceph Monitors enable monitoring the availability and health of the cluster.
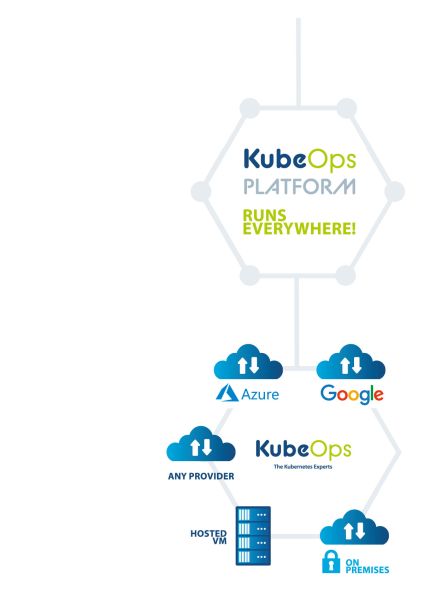
KubeOps PLATFORM runs everywhere

KubeOps PLATFORM only requires an clean OS installation for its nodes to create and operate clusters through there complete life-cycle. KubeOps PLATFORM brings production ready K8s to all hypervisors and bare metal!

public cloud

IT infrastructure and services are accessible via internet.

private cloud

An exclusive cloud infrastructure available only to one organization, featuring enhanced security and control over data.

on-premises

Kubernetes clusters are deployed on company-owned servers, e.g. in their own data centers.

The included features and tools are designed to simplify the deployment, management and scaling of Kubernetes clusters with a focus on high level security.

Grafana

Calico

KubeOps KOSI

cert manager

K8s
logging and monitoring

KubeOps PLATFORM gives you the capability to centralize all relevant information about your infrastructure and application. Monitoring them continuously and alerting you, however you choose.
Kubeadm

security

All products we provide undergo a multistage security examination. And are continuously monitored for the latest vulnerabilities. Most publicly available packages contain critical vulnerabilities that endanger your systems of not removed before integrating them.

Multus

fileBeat

Rook
Podman
backup and restore

A complete backup solution is a must have for operating a stateful infrastructure. Enables all the Kubernetes objects you rely on to be securely stored in an object store of your choice.

policy enforcement

Your infrastructure, your rules. Limit, modify and enhance all changes to your cloud with state-of-the-art policy enforcement. 

OpenSearch

Firewall
secured supply chain

Sourcing Software for your infrastructure is a critical attack surface. KubeOps PLATFORM binds your application into repeatable transferable artefacts. Stage from your laptop till production without worrying about the images you need to power your applications. Wherever you move they follow.

Helm
automatic setup

Repeatable and easy setup allows you to manage your clusters with infrastructure as code. Build your KubeOps PLATFORM cluster from the OS layer with everything you need and configured however you like.
nginx

Velero
integrated storage

Most real-world applications require persistent storage that is fast and reliable. Integrated storage allows us to provide a fantastic cloud native storage solution out of the box. Production ready management for file, block and object storage with the flick of a switch.
containerd

Trivy
multi networking

The capability to deploy multiple networks side by side in the same cluster allows for increased security measures and simple zero downtime migration to other network plugins.

Prometheus

Open Policy Agent

NFTables

Red hat

Harbor

Logstash
high availability

Ensuring continuous operations is one of our highest goals. Kubernetes is an amazing starting point for high availability, but still leaves some single points of failure. We address these issues, like remote image registries and standalone load balancers, with custom peer-to-peer systems. This allows for all your infrastructure to be as reliable as possible.

get started!

KubeOps PLATFORM is committed to providing the best Kubernetes solution on the market with continuous updates, improvements and support. 

Any Questions?

Please feel free to contact us for any question that is not answered yet. 

We are looking forward to get in contact with you!

Design Escapes

KubeOps GmbH
Hinter Stöck 17
72406 Bisingen
Germany

  • Telefon:

    +49 7433 93724 90

  • Mail:

    This email address is being protected from spambots. You need JavaScript enabled to view it.

Download Area
Certified as

KubeOps GmbH is the owner of the Union trademark KubeOps with the registration number 018305184. 

© KubeOps GmbH. All rights reserved. Subsidiary of